15
15peptides
spectra
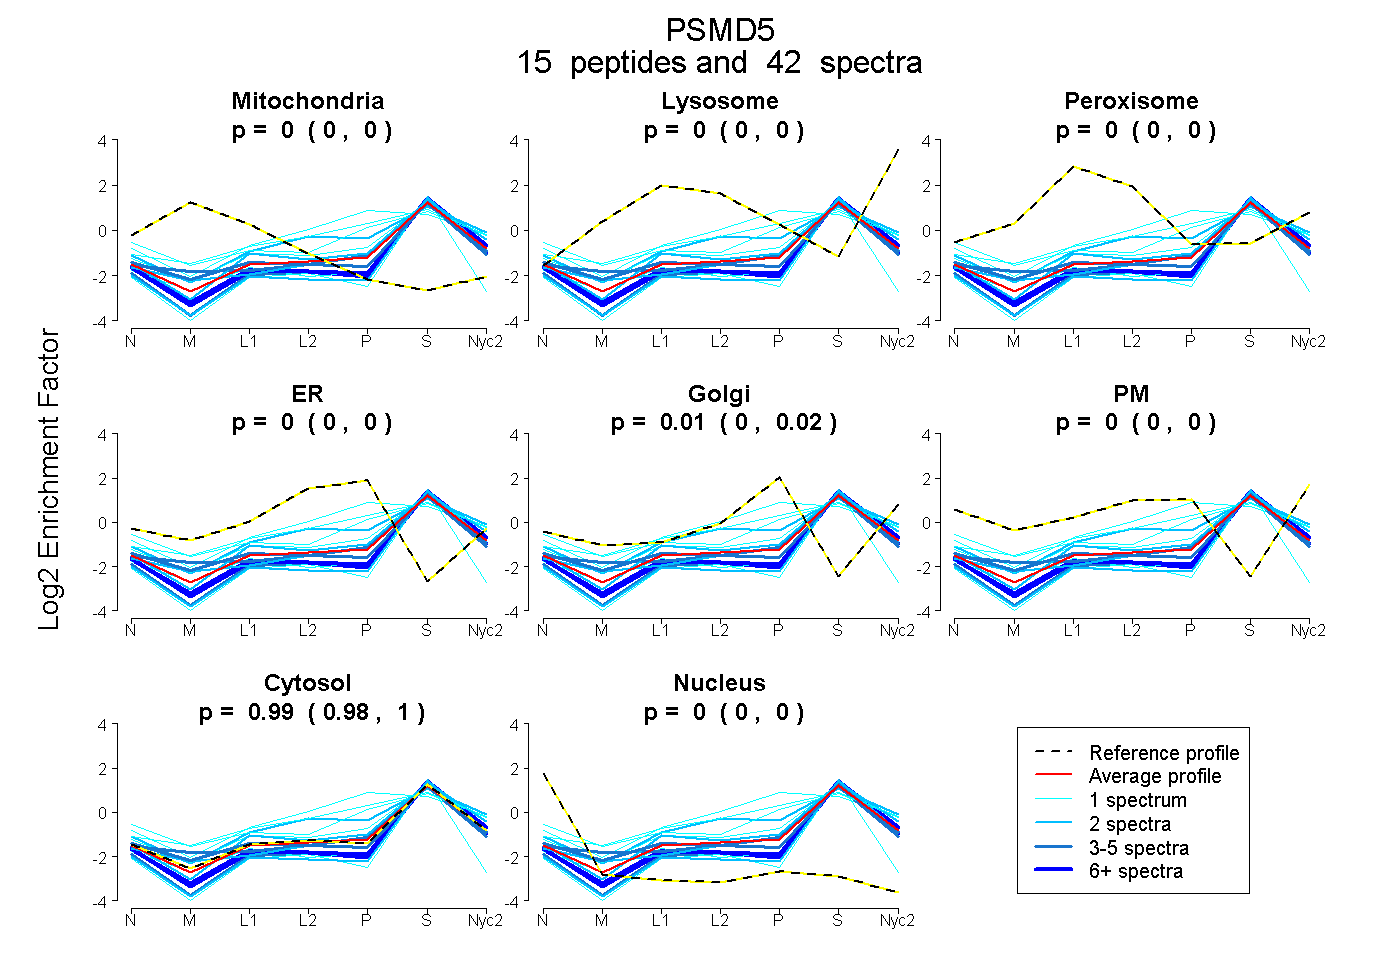
0.000 | 0.000
0.000 | 0.000
0.000 | 0.000
0.000 | 0.000
0.000 | 0.016
0.000 | 0.000
0.983 | 0.999
0.000 | 0.001
11peptides
spectra
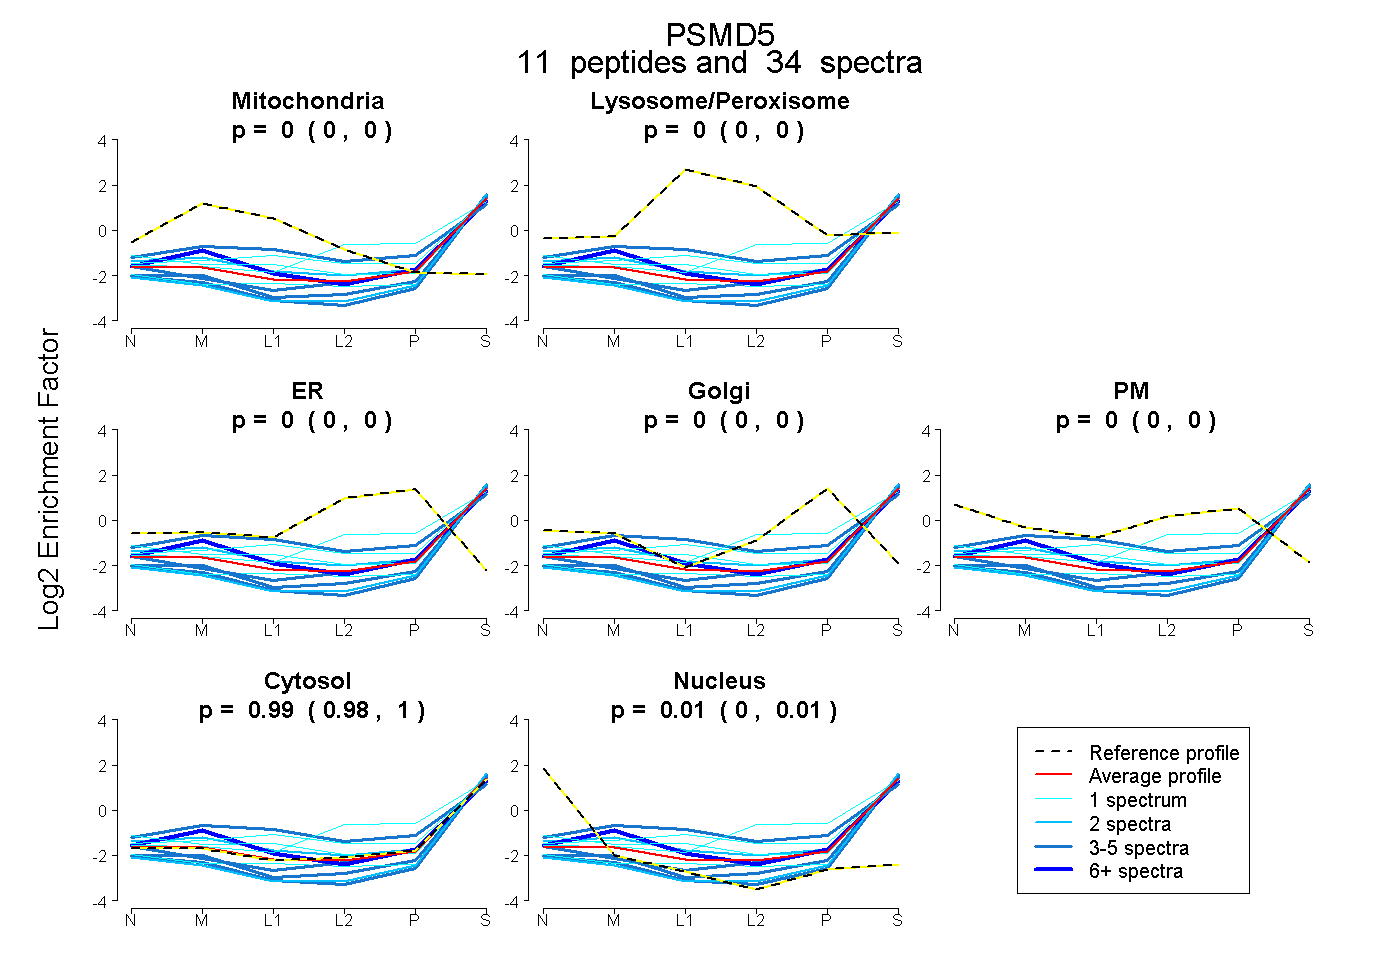
0.000 | 0.005
0.000 | 0.000
0.000 | 0.000
0.000 | 0.000
0.000 | 0.000
0.984 | 0.995
0.002 | 0.015
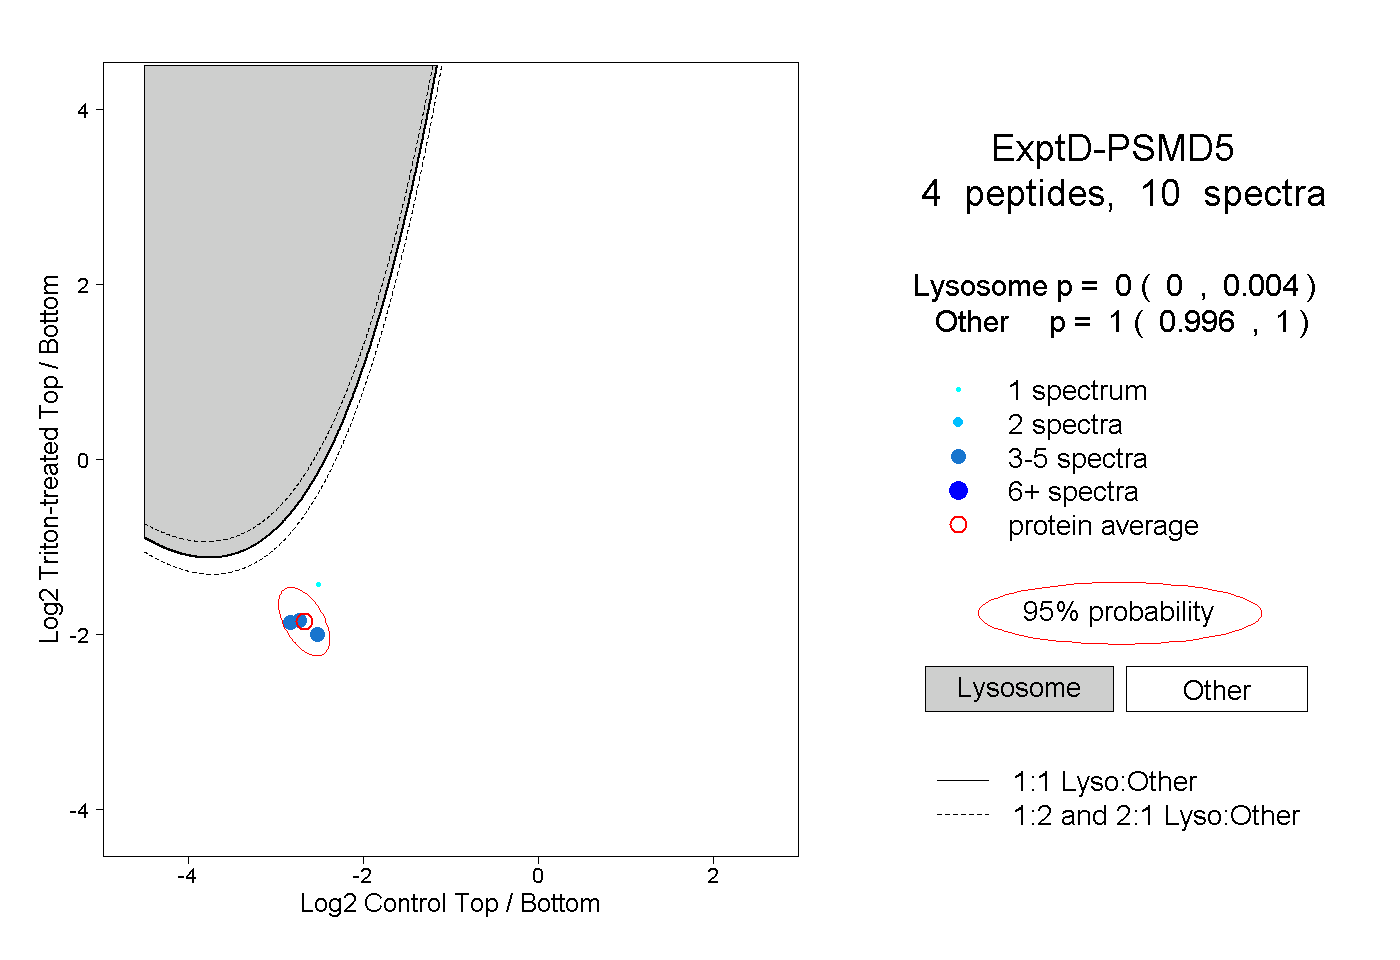
13peptides
spectra
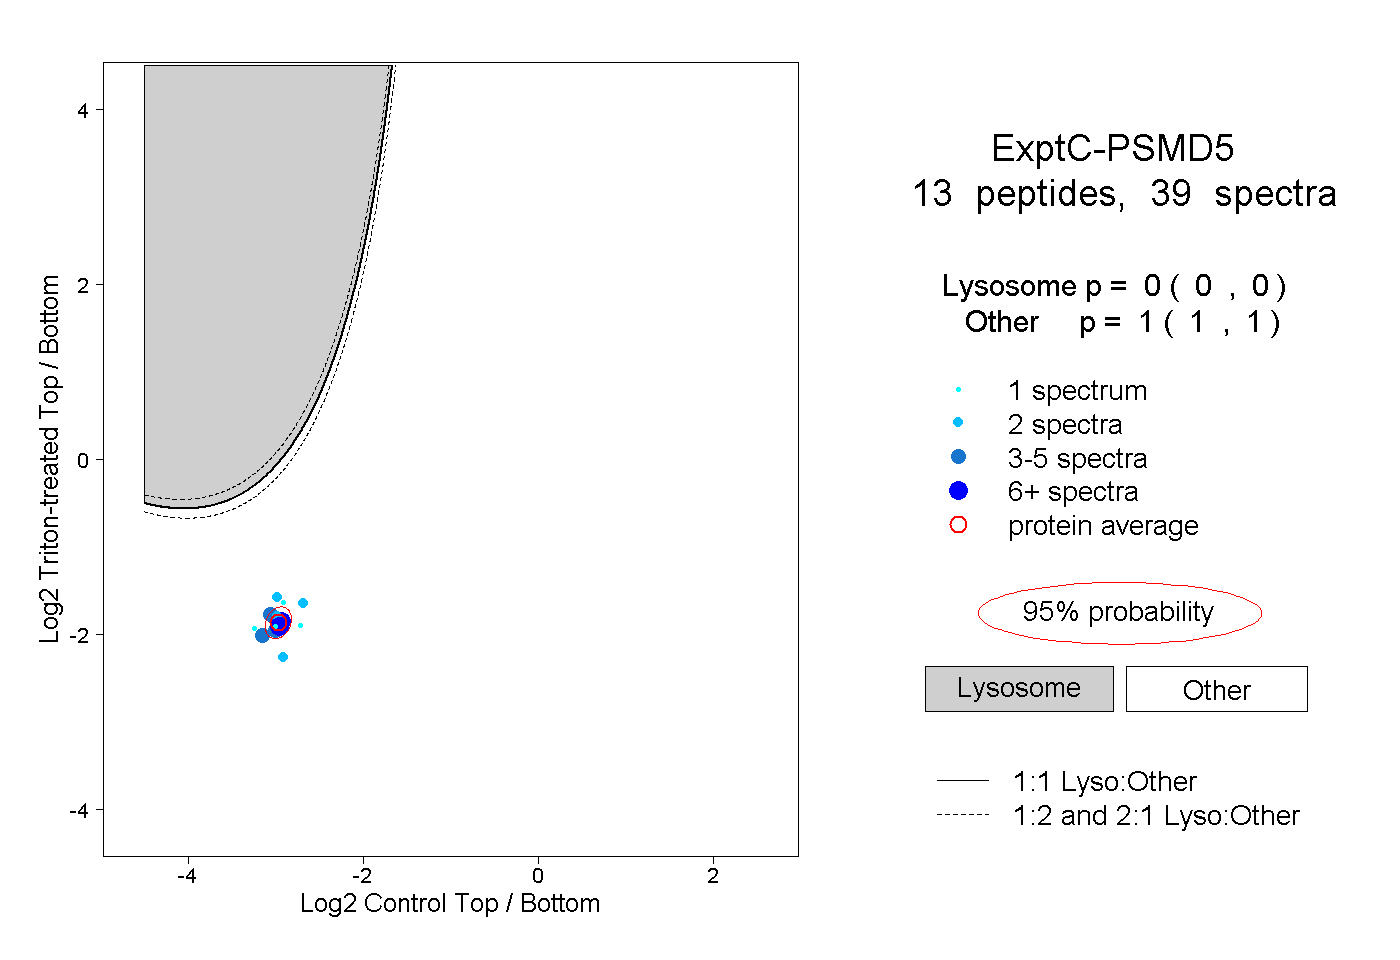
0.000 | 0.000
1.000 | 1.000