 15
15peptides
spectra
0.000 | 0.000
0.000 | 0.000
0.000 | 0.000
0.000 | 0.000
0.000 | 0.016
0.000 | 0.000
0.983 | 0.999
0.000 | 0.001
| Plot | Mito | Lyso | Perox | ER | Golgi | PM | Cytosol | Nucleus | |||||
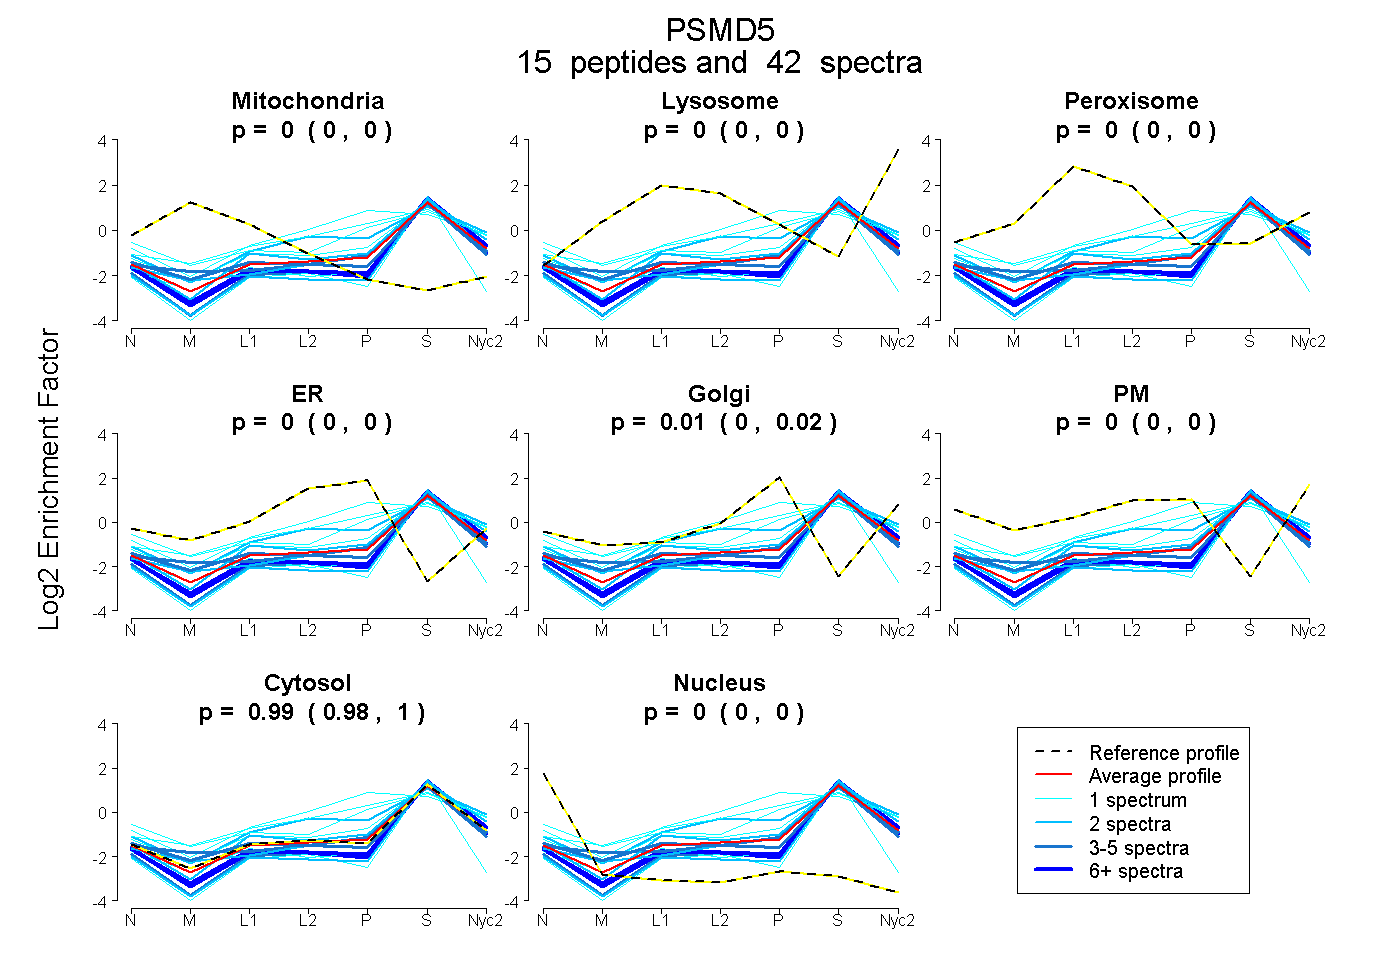
| Expt A |
15 peptides |
42 spectra |
|
0.000 0.000 | 0.000 |
0.000 0.000 | 0.000 |
0.000 0.000 | 0.000 |
0.000 0.000 | 0.000 |
0.008 0.000 | 0.016 |
0.000 0.000 | 0.000 |
0.992 0.983 | 0.999 |
0.000 0.000 | 0.001 |
| 4 spectra, LLQAVEPIHLAR | 0.062 | 0.000 | 0.000 | 0.000 | 0.004 | 0.000 | 0.934 | 0.000 | ||
| 3 spectra, YPVFLEK | 0.049 | 0.000 | 0.000 | 0.000 | 0.000 | 0.000 | 0.951 | 0.000 | ||
| 2 spectra, GLTHPDDSVK | 0.000 | 0.115 | 0.000 | 0.116 | 0.000 | 0.000 | 0.769 | 0.000 | ||
| 1 spectrum, ALQSVVQAVPLHELR | 0.000 | 0.055 | 0.000 | 0.276 | 0.092 | 0.000 | 0.577 | 0.000 | ||
| 1 spectrum, IVEDSEAVTEVLSNAELLR | 0.000 | 0.000 | 0.000 | 0.000 | 0.000 | 0.000 | 0.960 | 0.040 | ||
| 8 spectra, ELTGEDVLVR | 0.000 | 0.000 | 0.000 | 0.000 | 0.000 | 0.000 | 0.982 | 0.018 | ||
| 4 spectra, DSLELFR | 0.000 | 0.000 | 0.000 | 0.000 | 0.000 | 0.000 | 0.979 | 0.021 | ||
| 1 spectrum, IGYQAK | 0.000 | 0.057 | 0.011 | 0.000 | 0.062 | 0.000 | 0.870 | 0.000 | ||
| 2 spectra, SVEHDK | 0.000 | 0.000 | 0.000 | 0.017 | 0.000 | 0.000 | 0.983 | 0.000 | ||
| 1 spectrum, EQTALCVSILER | 0.000 | 0.000 | 0.000 | 0.000 | 0.000 | 0.000 | 0.859 | 0.141 | ||
| 2 spectra, TVAEIFGNSNYLR | 0.000 | 0.000 | 0.000 | 0.000 | 0.000 | 0.000 | 0.968 | 0.032 | ||
| 1 spectrum, QVVCCIGGENLSVAK | 0.000 | 0.000 | 0.066 | 0.000 | 0.249 | 0.028 | 0.656 | 0.000 | ||
| 9 spectra, LEAPLEELR | 0.000 | 0.000 | 0.000 | 0.000 | 0.000 | 0.000 | 0.963 | 0.037 | ||
| 2 spectra, TLTLSQIGR | 0.000 | 0.000 | 0.000 | 0.000 | 0.000 | 0.000 | 1.000 | 0.000 | ||
| 1 spectrum, VFTAIANQPWAQK | 0.000 | 0.077 | 0.061 | 0.104 | 0.128 | 0.000 | 0.629 | 0.000 |
| Plot | Mito | Lyso or Perox | ER | Golgi | PM | Cytosol | Nucleus | ||||||
| Expt B |
11 peptides |
34 spectra |
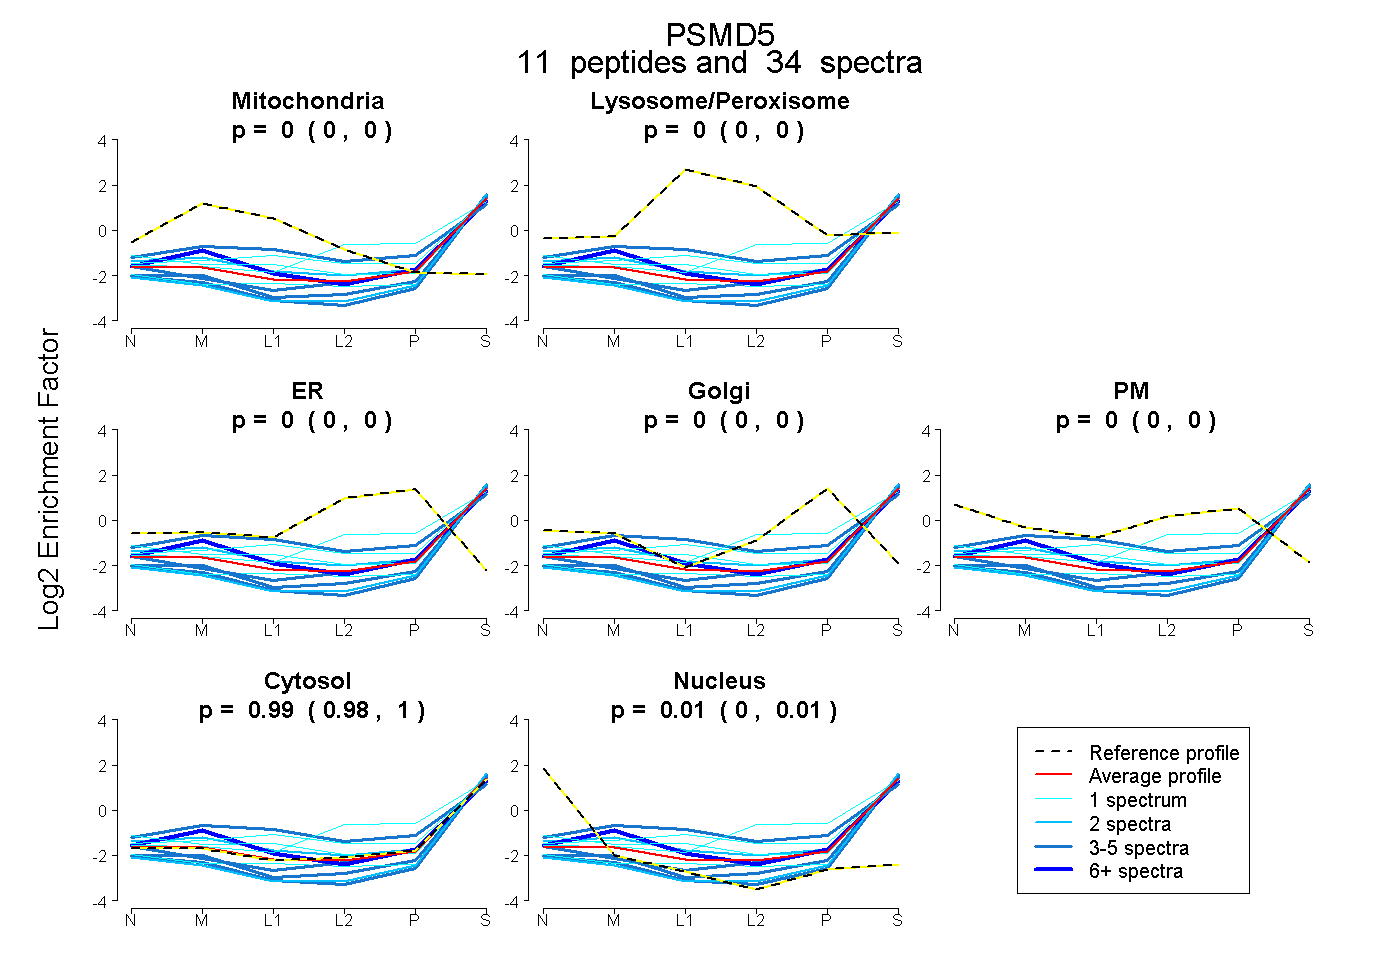 |
0.000 0.000 | 0.005 |
0.000 0.000 | 0.000 |
0.000 0.000 | 0.000 |
0.000 0.000 | 0.000 |
0.000 0.000 | 0.000 |
0.990 0.984 | 0.995 |
0.010 0.002 | 0.015 |
|||
| Plot | Lyso | Other | |||||||||||
| Expt C |
13 peptides |
39 spectra |
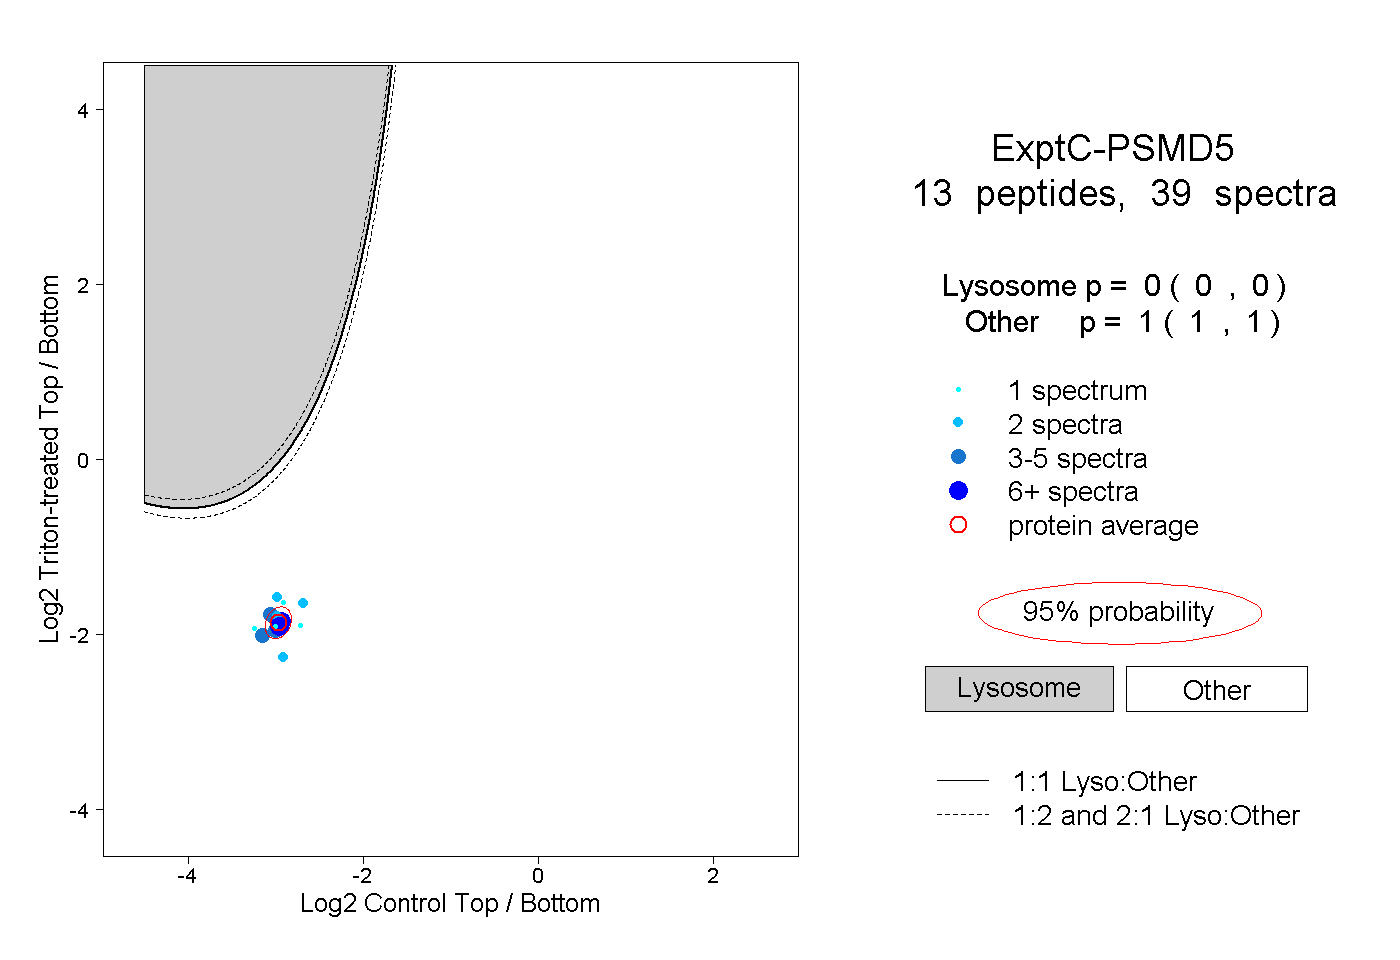 |
0.000 0.000 | 0.000 |
1.000 1.000 | 1.000 |
||||||||
| Plot | Lyso | Other | |||||||||||
| Expt D |
4 peptides |
10 spectra |
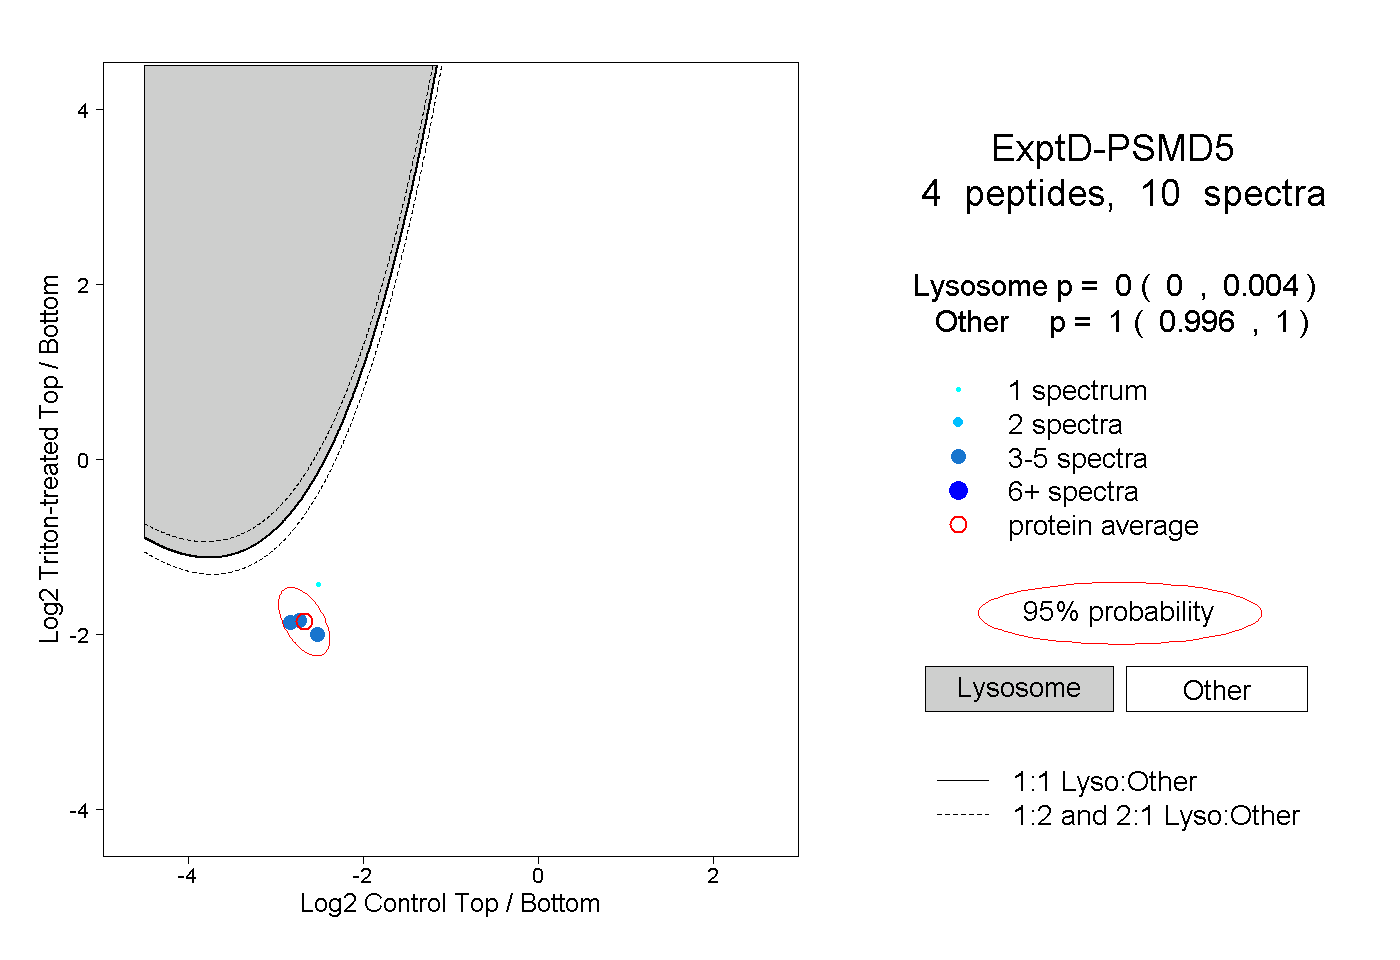 |
0.000 0.000 | 0.004 |
1.000 0.996 | 1.000 |