 12
12peptides
spectra
0.000 | 0.003
0.000 | 0.000
0.060 | 0.067
0.853 | 0.864
0.000 | 0.000
0.000 | 0.000
0.030 | 0.046
0.033 | 0.041
| Plot | Mito | Lyso | Perox | ER | Golgi | PM | Cytosol | Nucleus | |||||
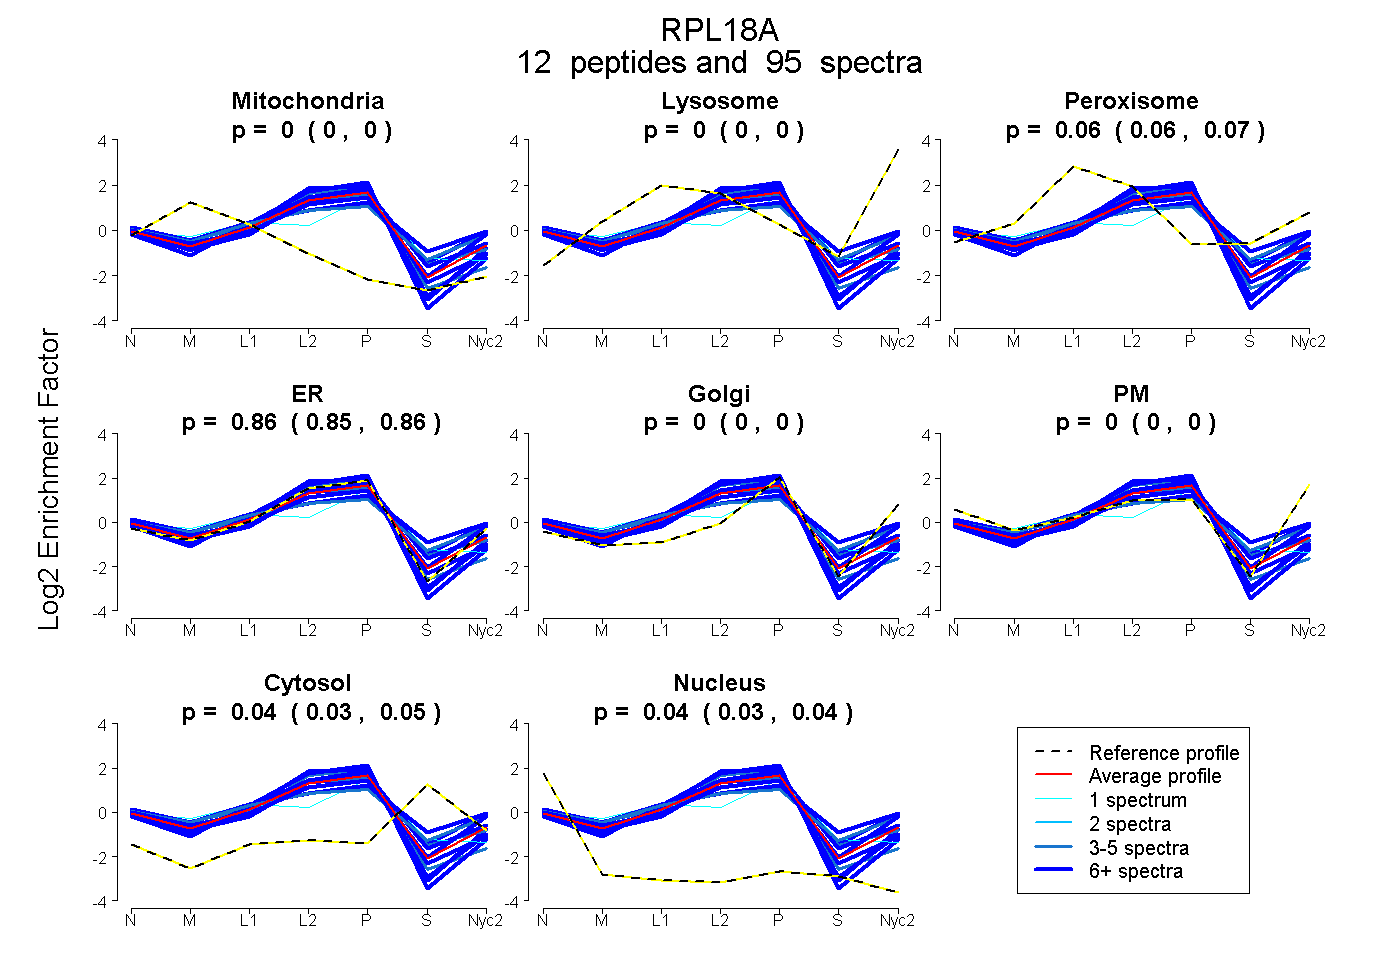
| Expt A |
12 peptides |
95 spectra |
|
0.000 0.000 | 0.003 |
0.000 0.000 | 0.000 |
0.065 0.060 | 0.067 |
0.859 0.853 | 0.864 |
0.000 0.000 | 0.000 |
0.000 0.000 | 0.000 |
0.039 0.030 | 0.046 |
0.038 0.033 | 0.041 |
| 1 spectrum, QFHDSK | 0.167 | 0.000 | 0.031 | 0.645 | 0.000 | 0.000 | 0.157 | 0.000 | ||
| 9 spectra, FPLPHR | 0.000 | 0.000 | 0.000 | 0.977 | 0.000 | 0.000 | 0.000 | 0.023 | ||
| 10 spectra, DLTTAGAVTQCYR | 0.000 | 0.000 | 0.030 | 0.917 | 0.000 | 0.000 | 0.000 | 0.052 | ||
| 12 spectra, VEEIAAGK | 0.046 | 0.000 | 0.017 | 0.708 | 0.000 | 0.150 | 0.078 | 0.000 | ||
| 6 spectra, ASGTLR | 0.014 | 0.000 | 0.000 | 0.947 | 0.000 | 0.000 | 0.000 | 0.039 | ||
| 3 spectra, SSGEIVYCGQVFEK | 0.031 | 0.000 | 0.193 | 0.499 | 0.051 | 0.077 | 0.141 | 0.008 | ||
| 11 spectra, NFGIWLR | 0.000 | 0.000 | 0.000 | 0.983 | 0.000 | 0.000 | 0.000 | 0.017 | ||
| 10 spectra, AHSIQIMK | 0.000 | 0.000 | 0.057 | 0.687 | 0.000 | 0.122 | 0.134 | 0.000 | ||
| 3 spectra, CHTPPLYR | 0.035 | 0.000 | 0.097 | 0.773 | 0.000 | 0.000 | 0.095 | 0.000 | ||
| 3 spectra, CLPTPK | 0.000 | 0.000 | 0.000 | 0.933 | 0.000 | 0.000 | 0.000 | 0.067 | ||
| 9 spectra, SGTHNMYR | 0.000 | 0.000 | 0.225 | 0.431 | 0.089 | 0.096 | 0.159 | 0.000 | ||
| 18 spectra, IFAPNHVVAK | 0.000 | 0.000 | 0.020 | 0.848 | 0.000 | 0.000 | 0.132 | 0.000 |
| Plot | Mito | Lyso or Perox | ER | Golgi | PM | Cytosol | Nucleus | ||||||
| Expt B |
8 peptides |
37 spectra |
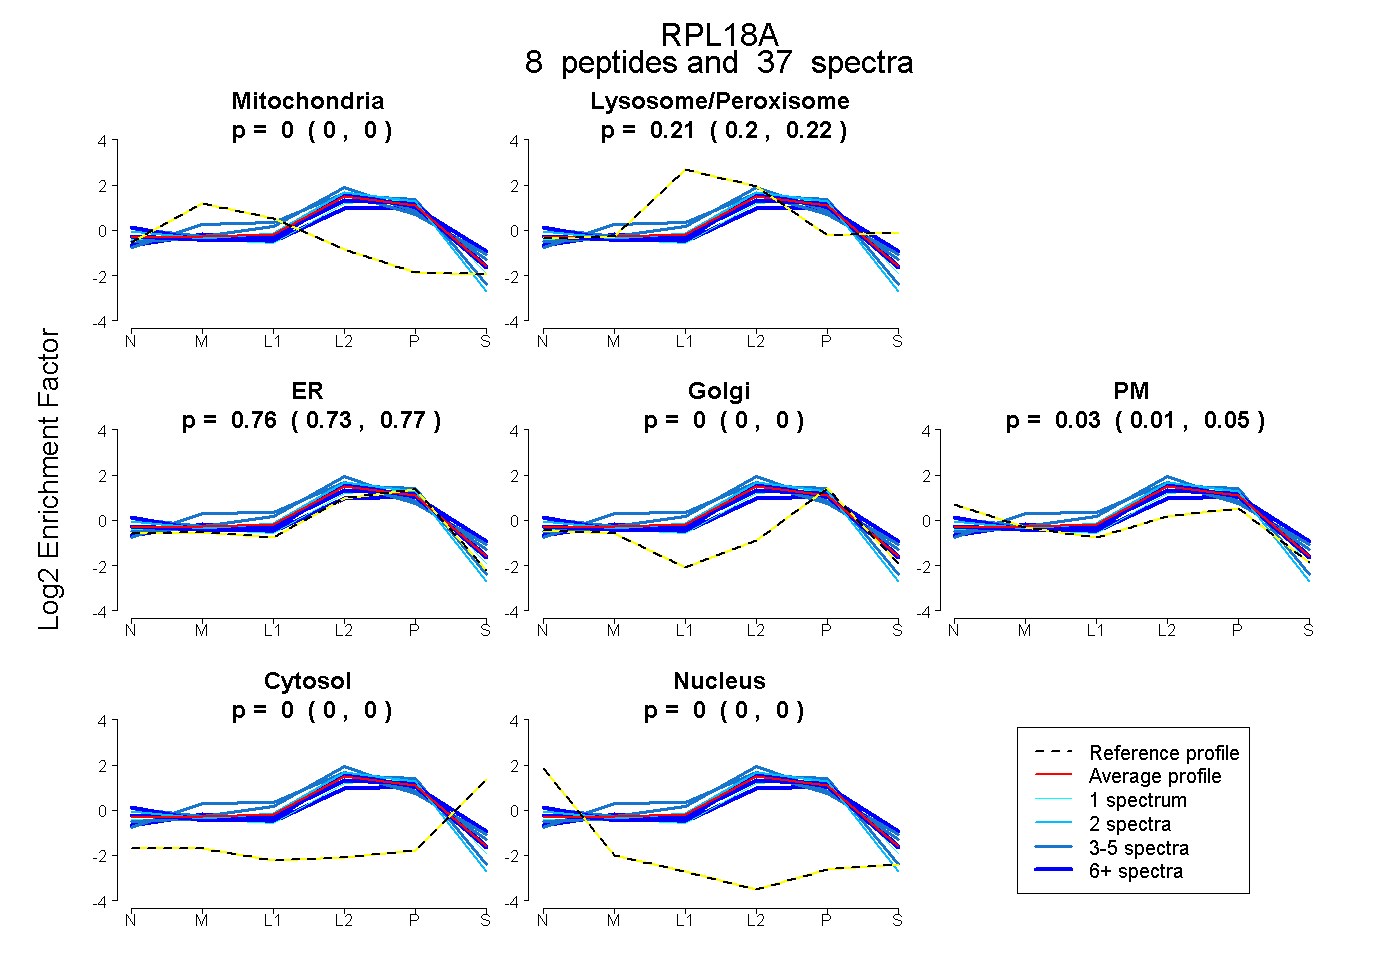 |
0.000 0.000 | 0.000 |
0.212 0.202 | 0.219 |
0.755 0.732 | 0.774 |
0.000 0.000 | 0.000 |
0.033 0.011 | 0.052 |
0.000 0.000 | 0.000 |
0.000 0.000 | 0.000 |
|||
| Plot | Lyso | Other | |||||||||||
| Expt C |
12 peptides |
164 spectra |
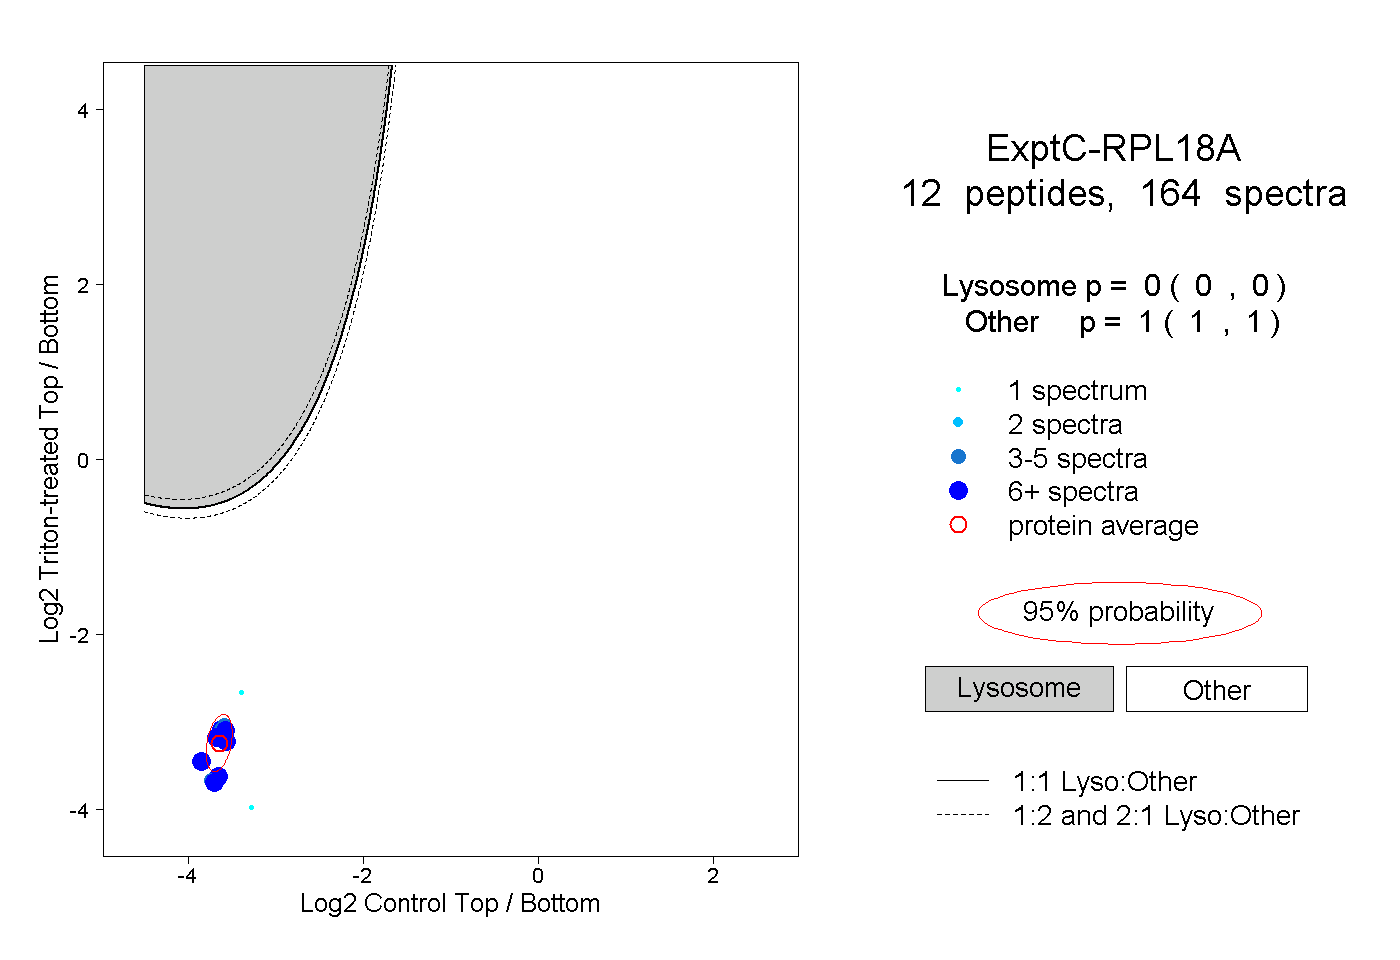 |
0.000 0.000 | 0.000 |
1.000 1.000 | 1.000 |
||||||||
| Plot | Lyso | Other | |||||||||||
| Expt D |
5 peptides |
13 spectra |
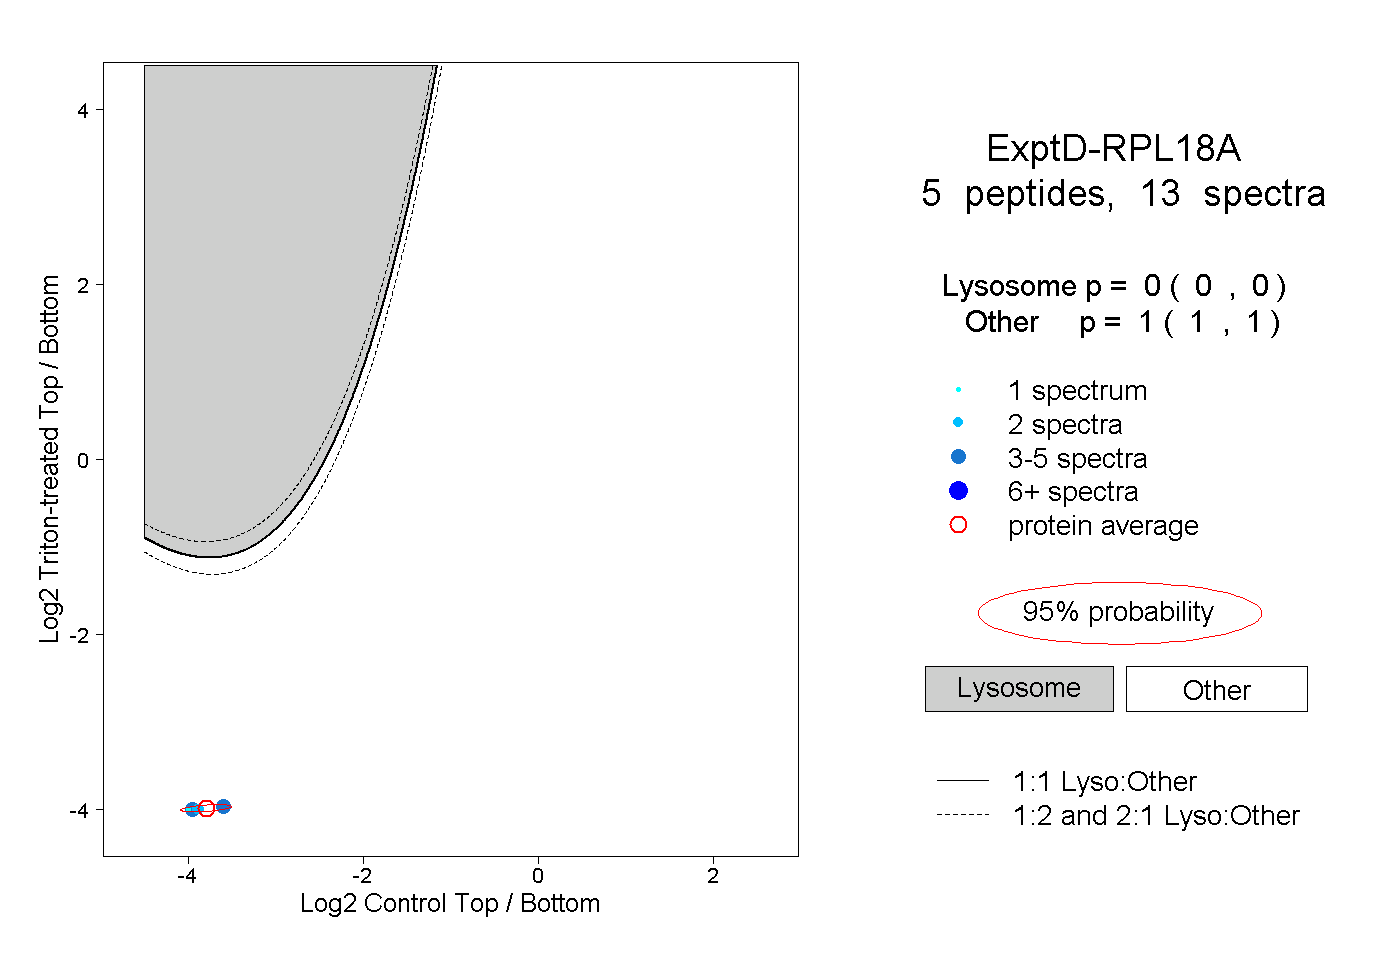 |
0.000 0.000 | 0.000 |
1.000 1.000 | 1.000 |