PICALM
[ENSRNOP00000025415]
Main page
| | | Plot |
Mito |
Lyso |
|
Perox |
ER |
Golgi |
PM |
Cytosol |
Nucleus |
|
| Expt A |
 18
18
peptides |
63
spectra |
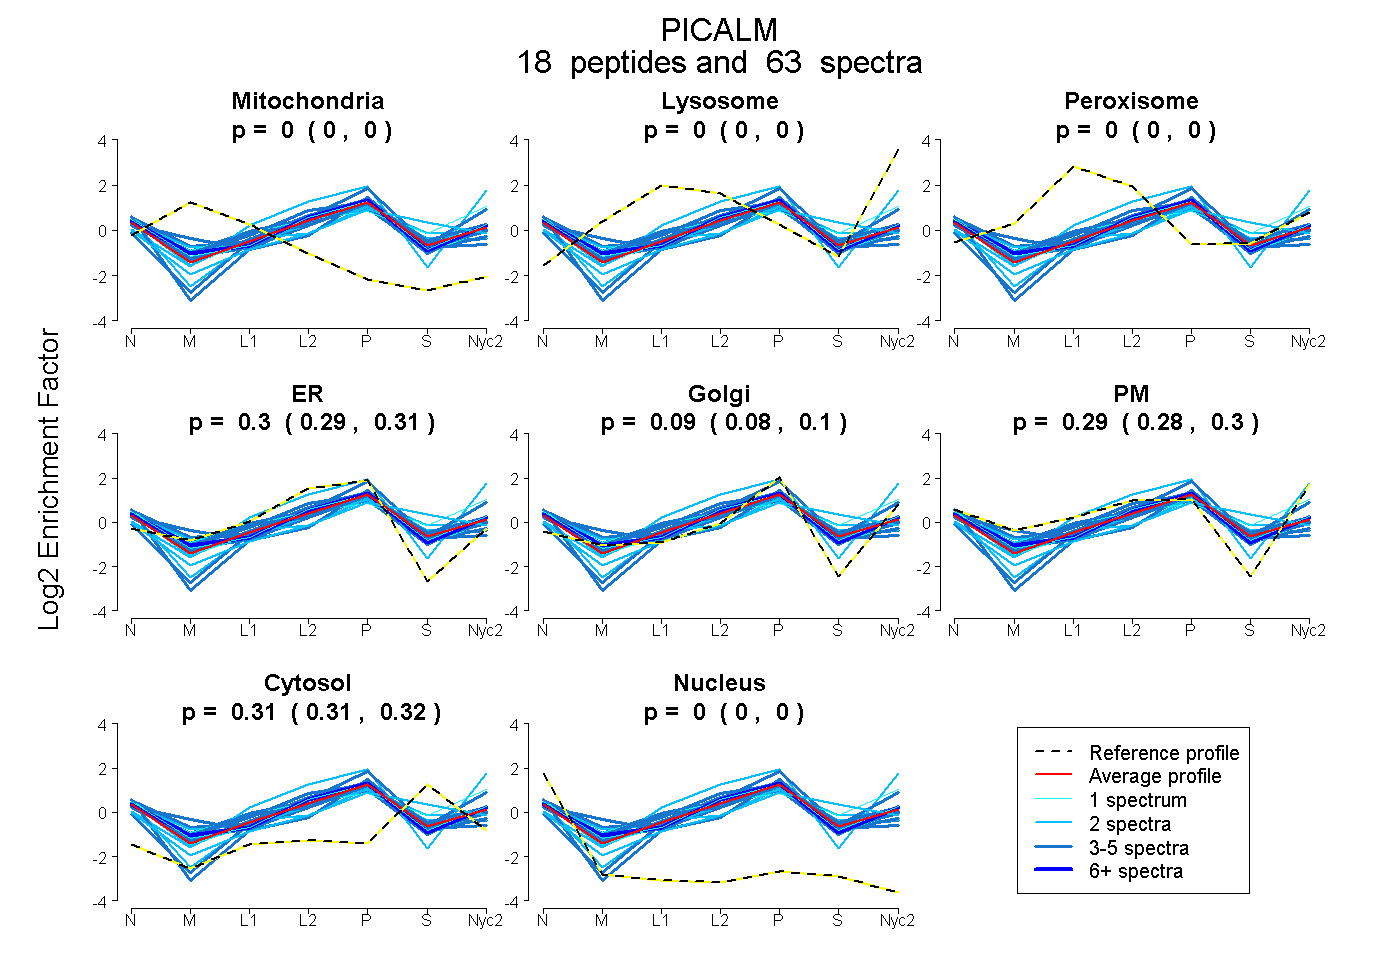 |
0.000
0.000 | 0.000 |
0.000
0.000 | 0.000 |
|
0.000
0.000 | 0.000 |
0.300
0.286 | 0.312 |
0.095
0.084 | 0.105 |
0.290
0.277 | 0.299 |
0.315
0.311 | 0.318 |
0.000
0.000 | 0.000 |
|
| | | Plot |
Mito |
|
Lyso or Perox |
|
ER |
Golgi |
PM |
Cytosol |
Nucleus |
|
| Expt B |
7
peptides |
17
spectra |
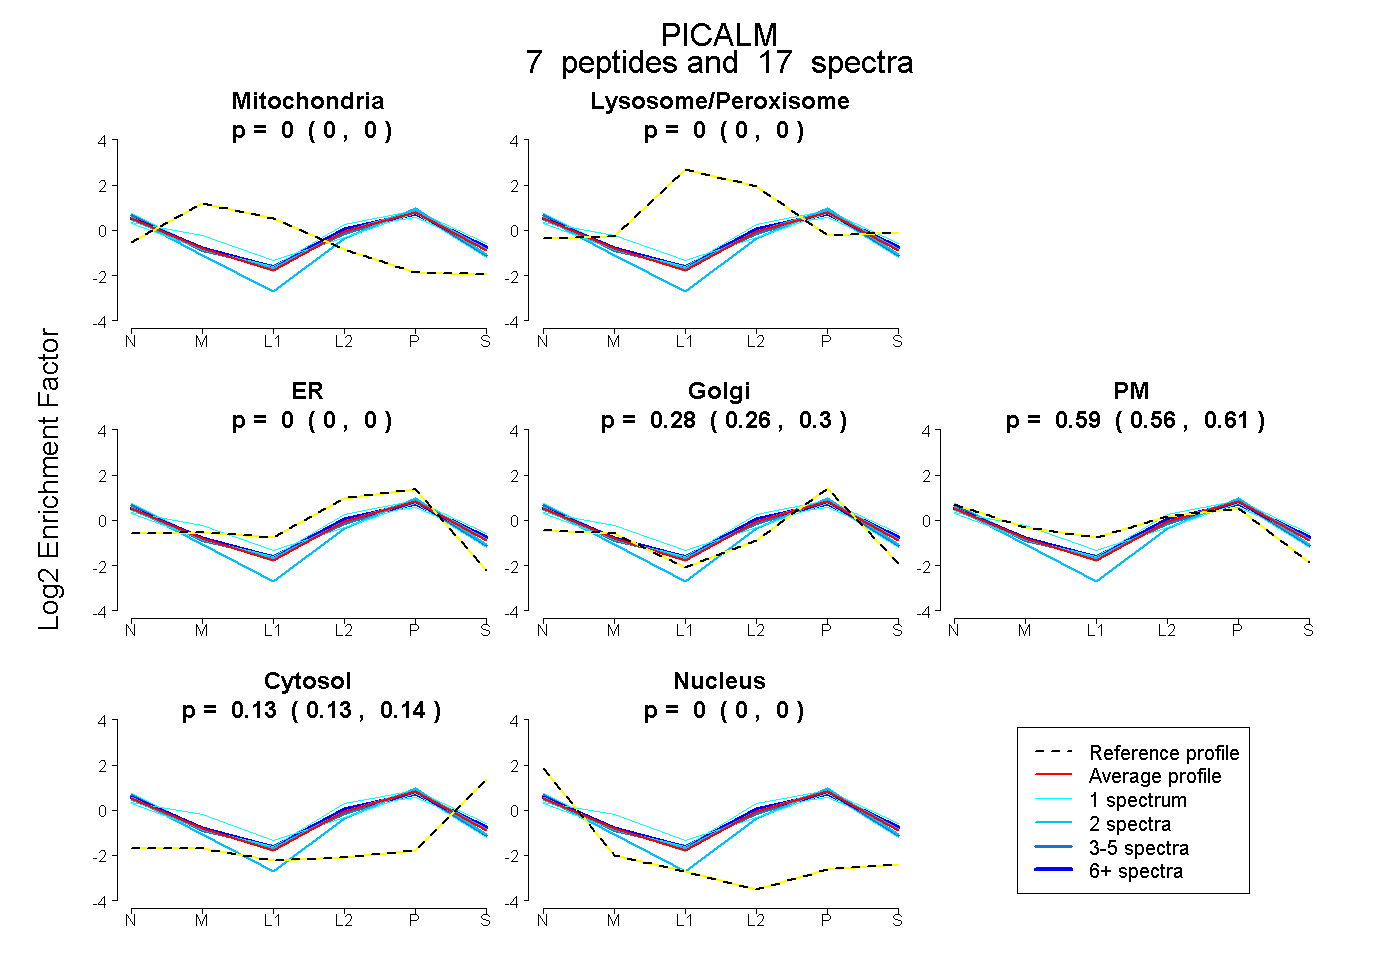 |
0.000
0.000 | 0.000 |
|
0.000
0.000 | 0.000 |
|
0.000
0.000 | 0.000 |
0.281
0.256 | 0.300 |
0.586
0.562 | 0.608 |
0.133
0.126 | 0.138 |
0.000
0.000 | 0.000 |
|
| 2 spectra, VAEQVGIDR |
0.000 |
|
0.000 |
|
0.000 |
0.266 |
0.596 |
0.138 |
0.000 |
|
| 1 spectrum, TMNTEK |
0.000 |
|
0.000 |
|
0.231 |
0.104 |
0.475 |
0.190 |
0.000 |
|
| 1 spectrum, FIQYLASR |
0.000 |
|
0.000 |
|
0.000 |
0.138 |
0.700 |
0.162 |
0.000 |
|
| 2 spectra, QAALEEEQAR |
0.000 |
|
0.000 |
|
0.000 |
0.639 |
0.216 |
0.090 |
0.055 |
|
| 1 spectrum, QVAFDFTK |
0.000 |
|
0.000 |
|
0.000 |
0.256 |
0.647 |
0.097 |
0.000 |
|
| 6 spectra, NTLFNLSNFLDK |
0.000 |
|
0.000 |
|
0.000 |
0.180 |
0.663 |
0.157 |
0.000 |
|
| 4 spectra, ISEFLK |
0.000 |
|
0.000 |
|
0.000 |
0.263 |
0.636 |
0.100 |
0.000 |
|
| | | Plot |
|
Lyso |
|
|
|
|
|
|
|
Other |
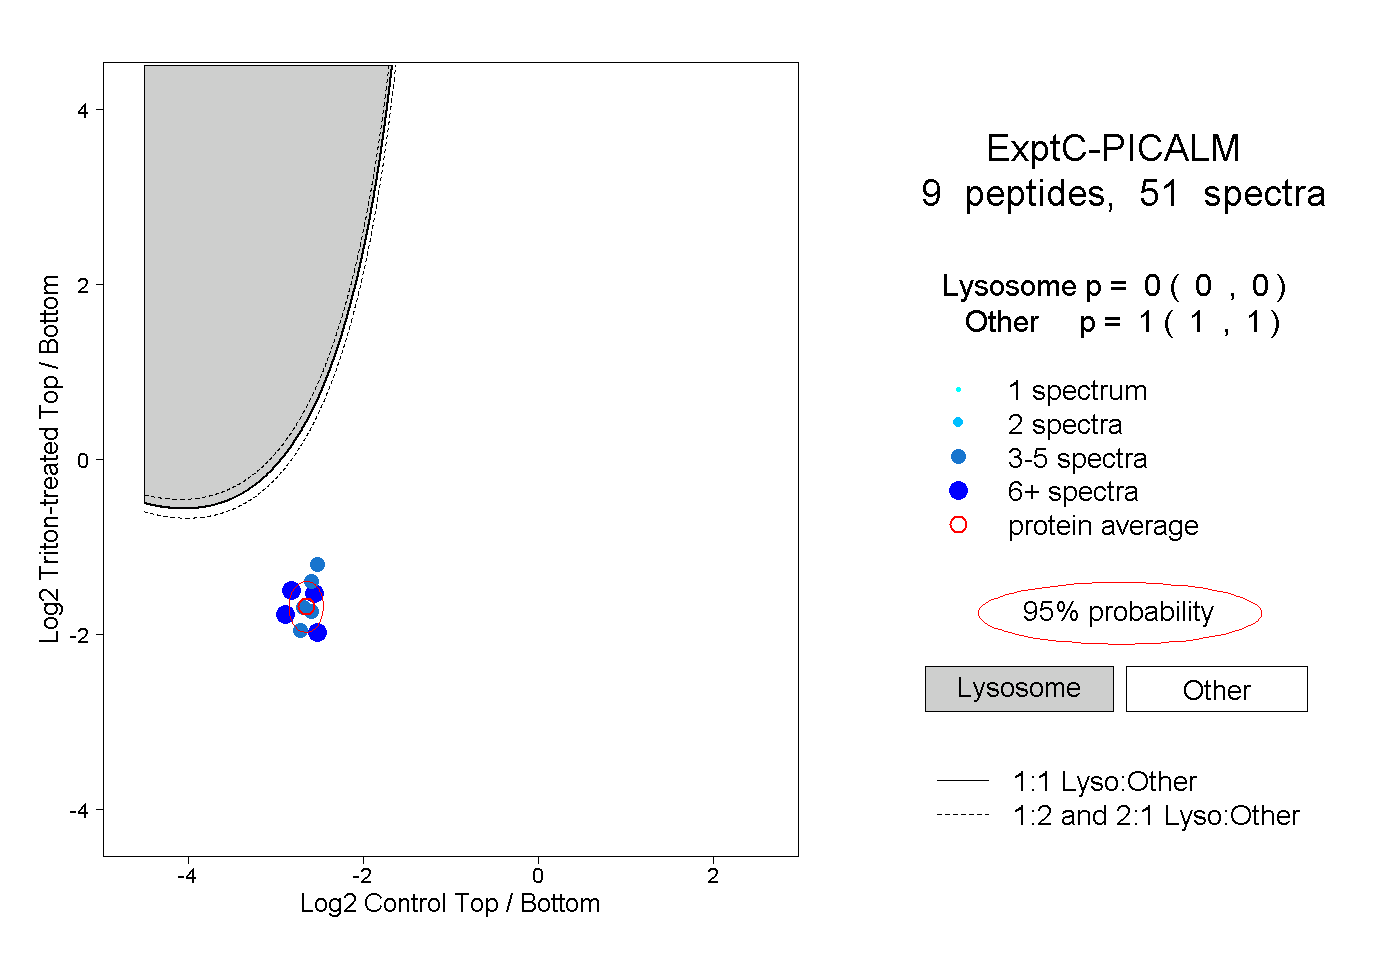
| Expt C |
9
peptides |
51
spectra |
 |
|
0.000
0.000 | 0.000 |
|
|
|
|
|
|
|
1.000
1.000 | 1.000 |
| | | Plot |
|
Lyso |
|
|
|
|
|
|
|
Other |
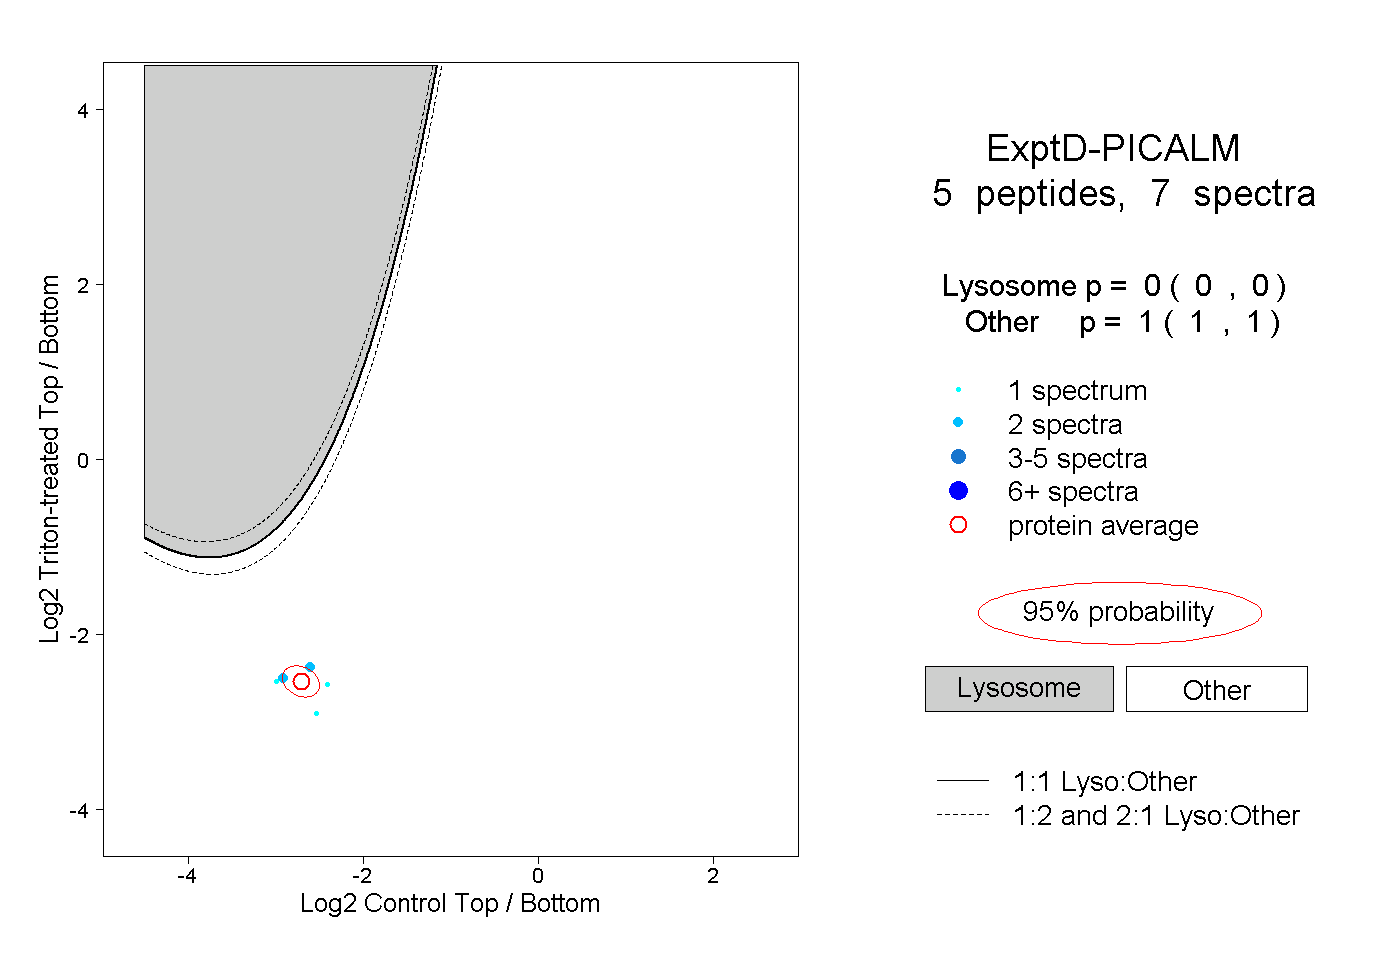
| Expt D |
5
peptides |
7
spectra |
 |
|
0.000
0.000 | 0.000 |
|
|
|
|
|
|
|
1.000
1.000 | 1.000 |