 12
12peptides
spectra
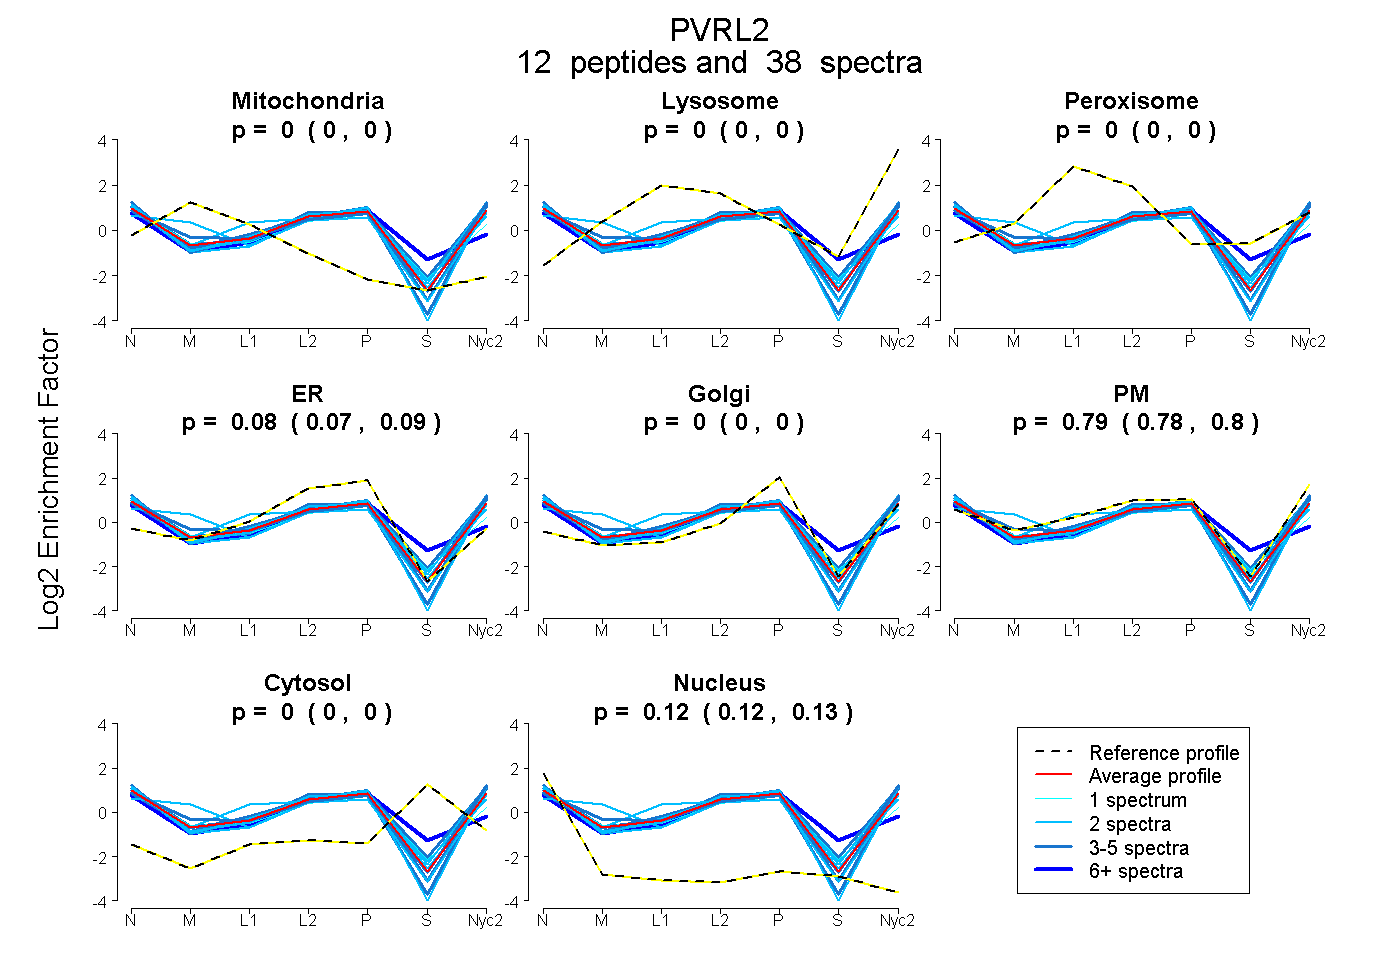
0.000 | 0.000
0.000 | 0.000
0.000 | 0.000
0.071 | 0.095
0.000 | 0.000
0.777 | 0.805
0.000 | 0.000
0.121 | 0.126
4peptides
spectra

0.000 | 0.000
0.000 | 0.000
0.000 | 0.000
0.000 | 0.047
0.816 | 0.900
0.000 | 0.000
0.096 | 0.133
10peptides
spectra
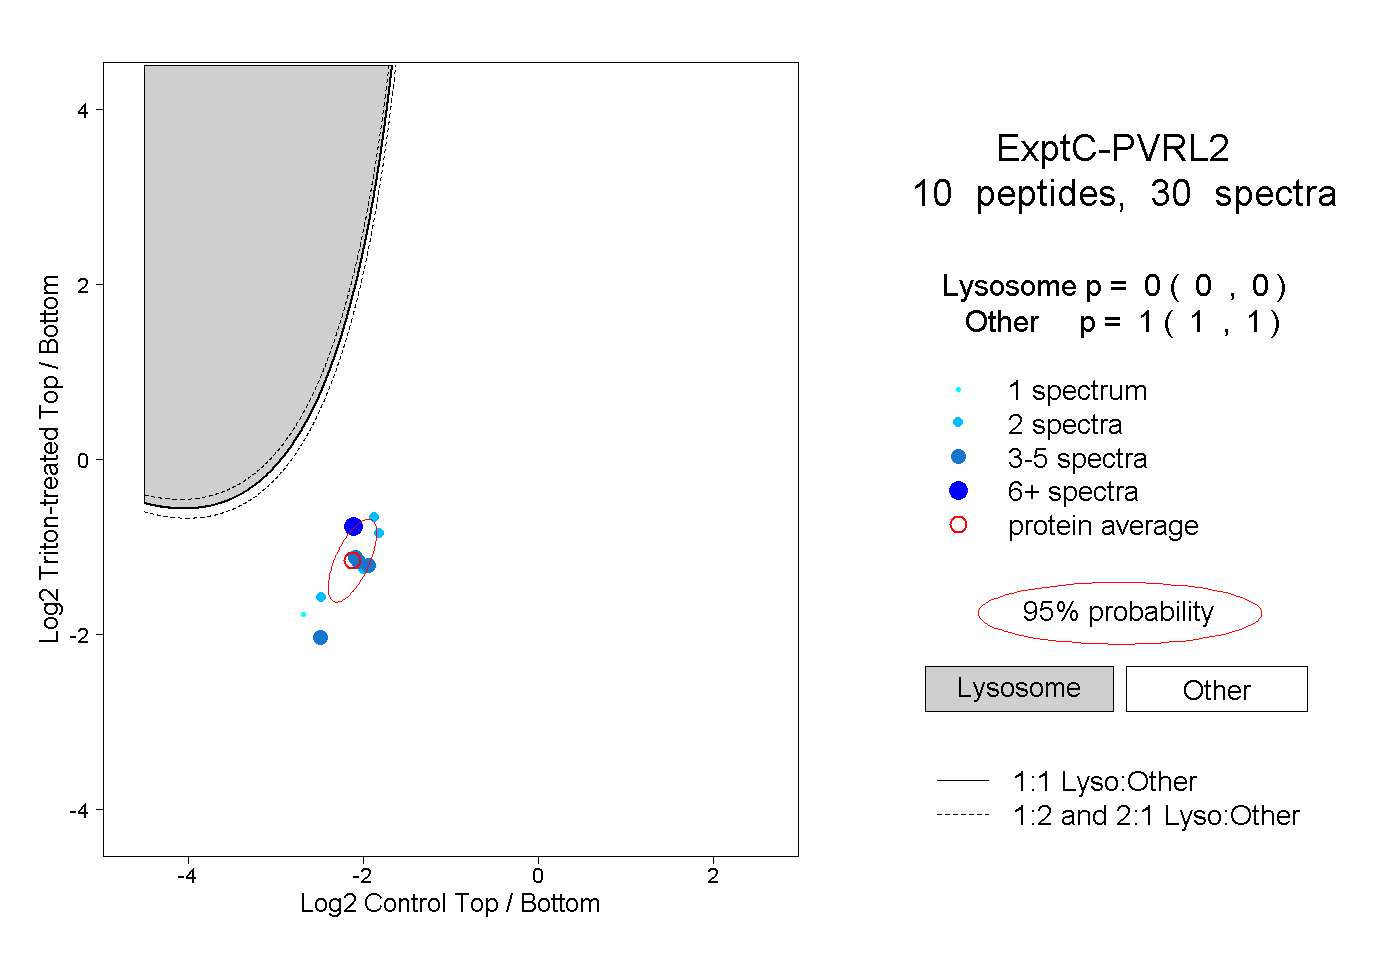
0.000 | 0.000
1.000 | 1.000
3peptides
spectra
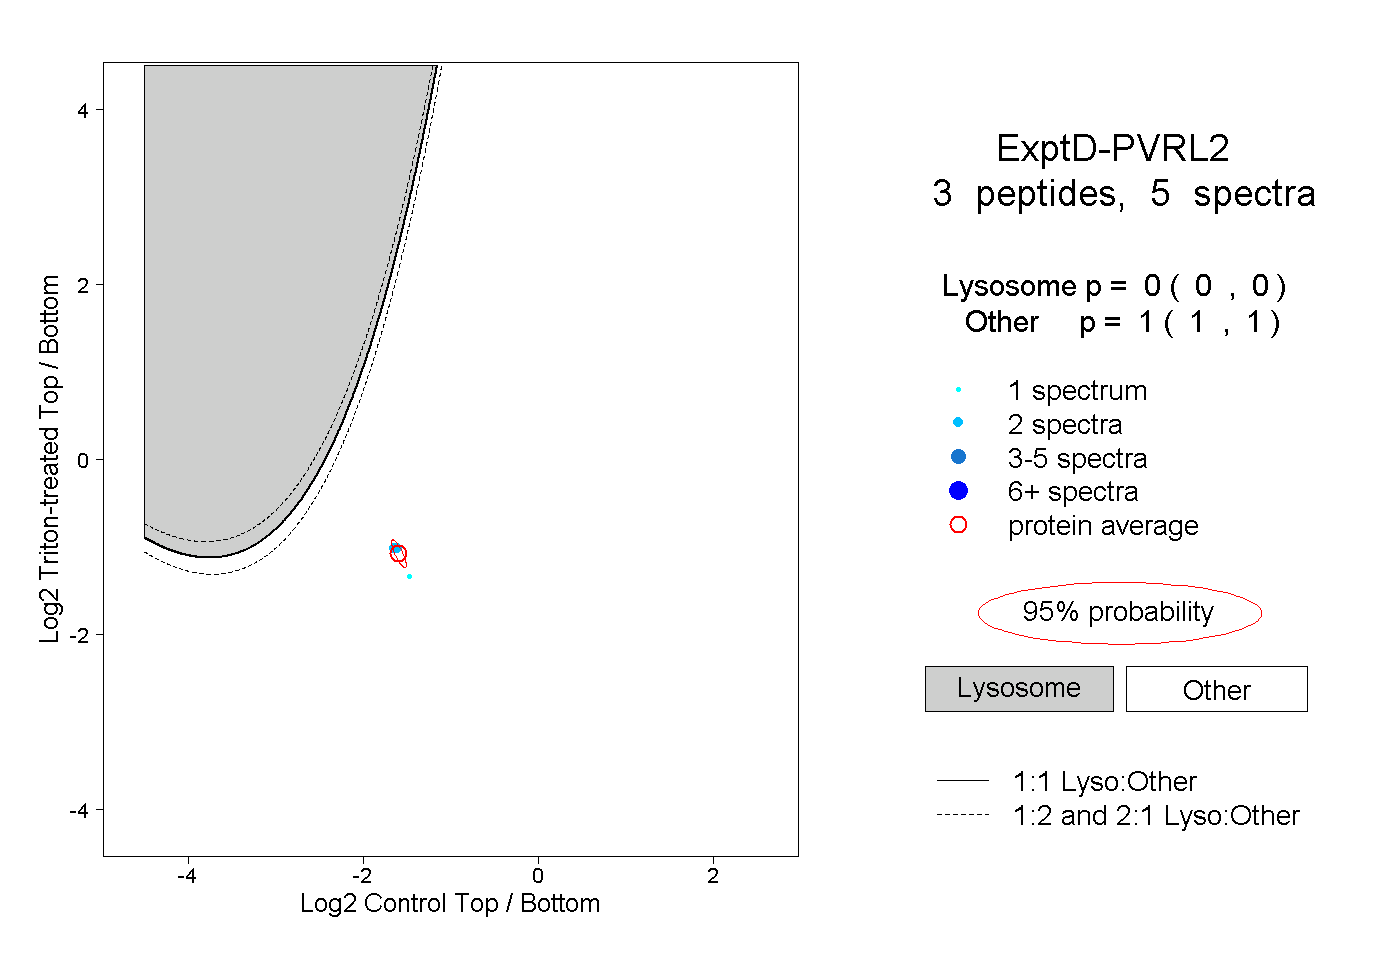
0.000 | 0.000
1.000 | 1.000