12
12peptides
spectra
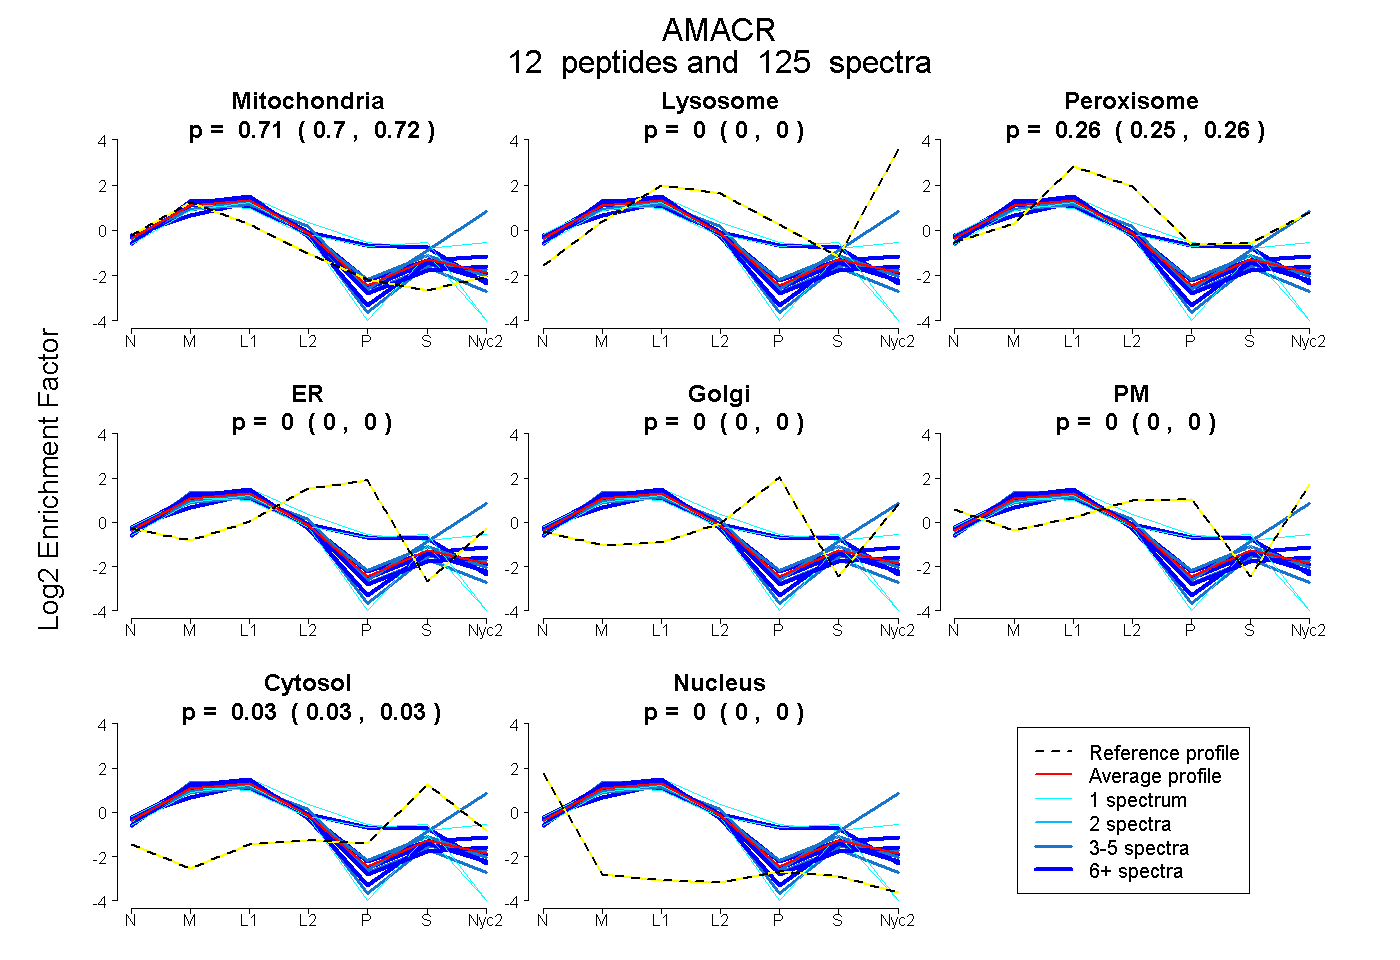
0.703 | 0.715
0.000 | 0.000
0.253 | 0.264
0.000 | 0.000
0.000 | 0.000
0.000 | 0.000
0.029 | 0.034
0.000 | 0.000
12peptides
spectra
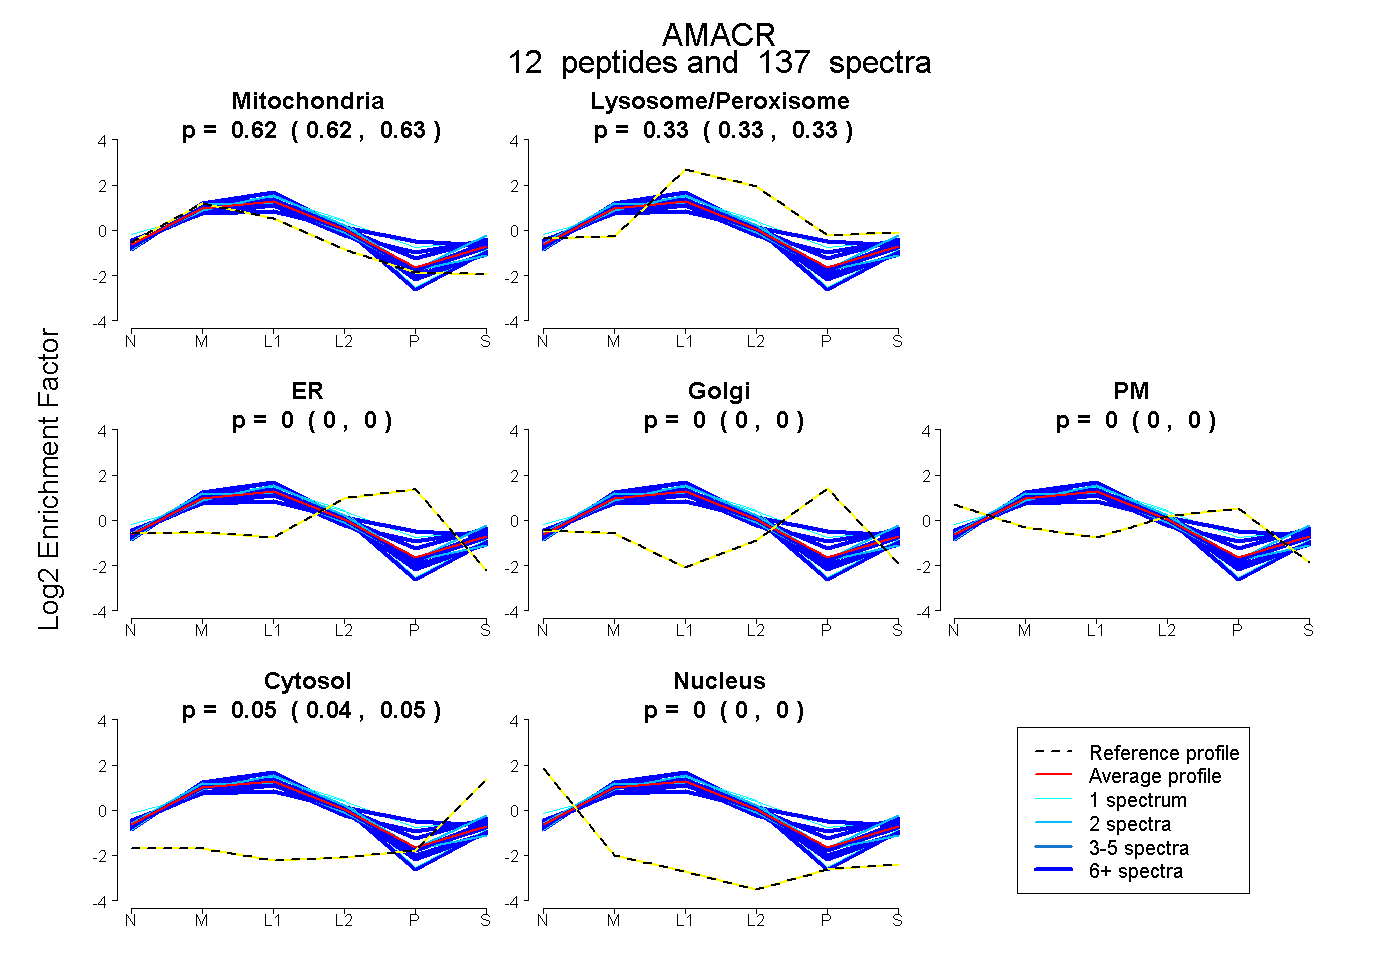
0.619 | 0.627
0.327 | 0.333
0.000 | 0.000
0.000 | 0.000
0.000 | 0.000
0.044 | 0.049
0.000 | 0.000
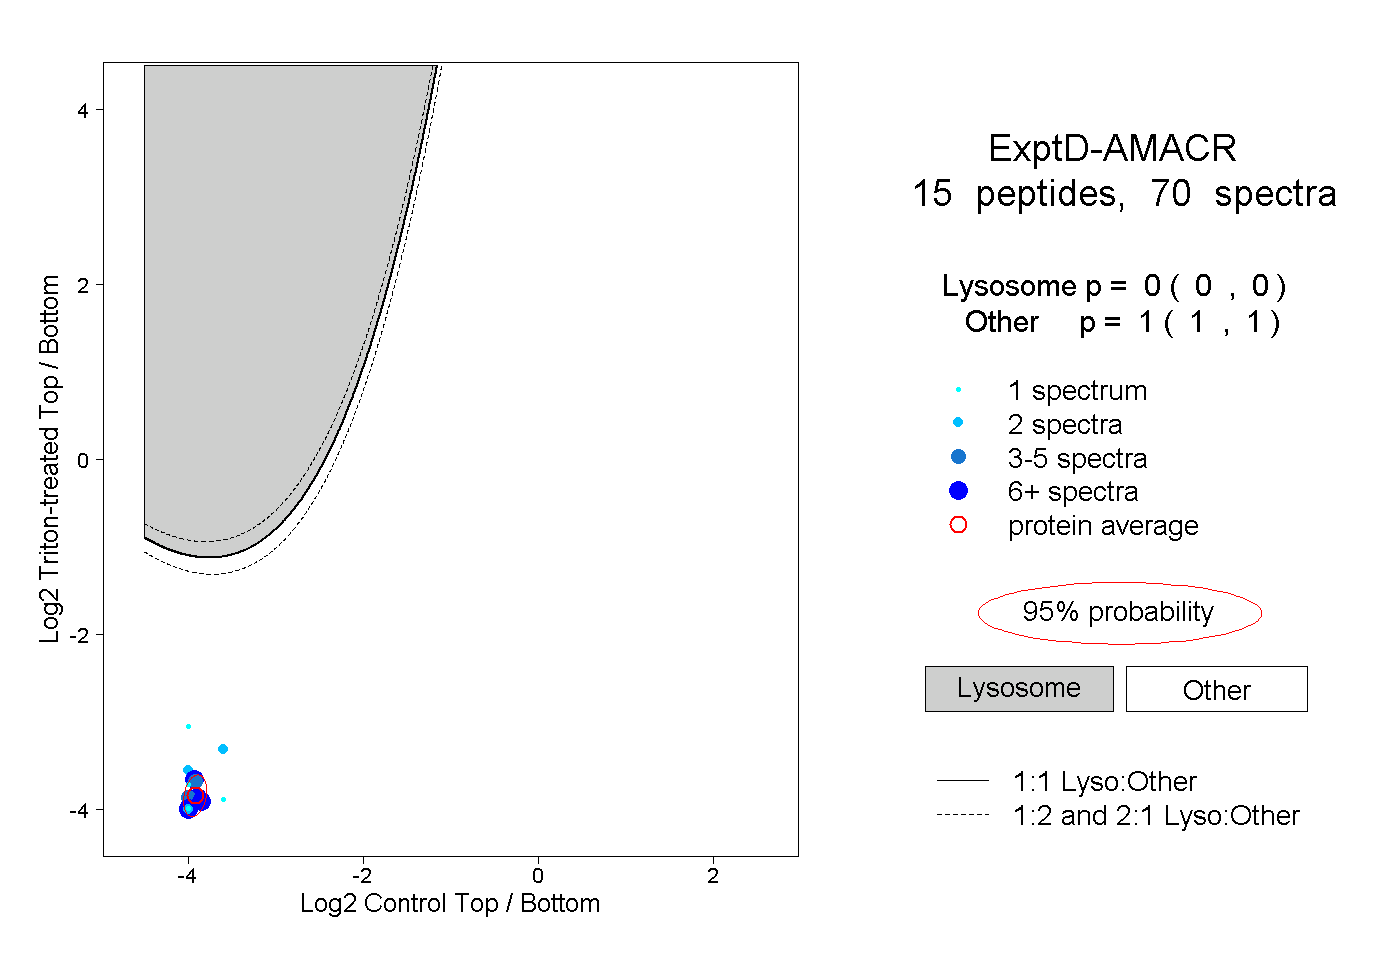
16peptides
spectra
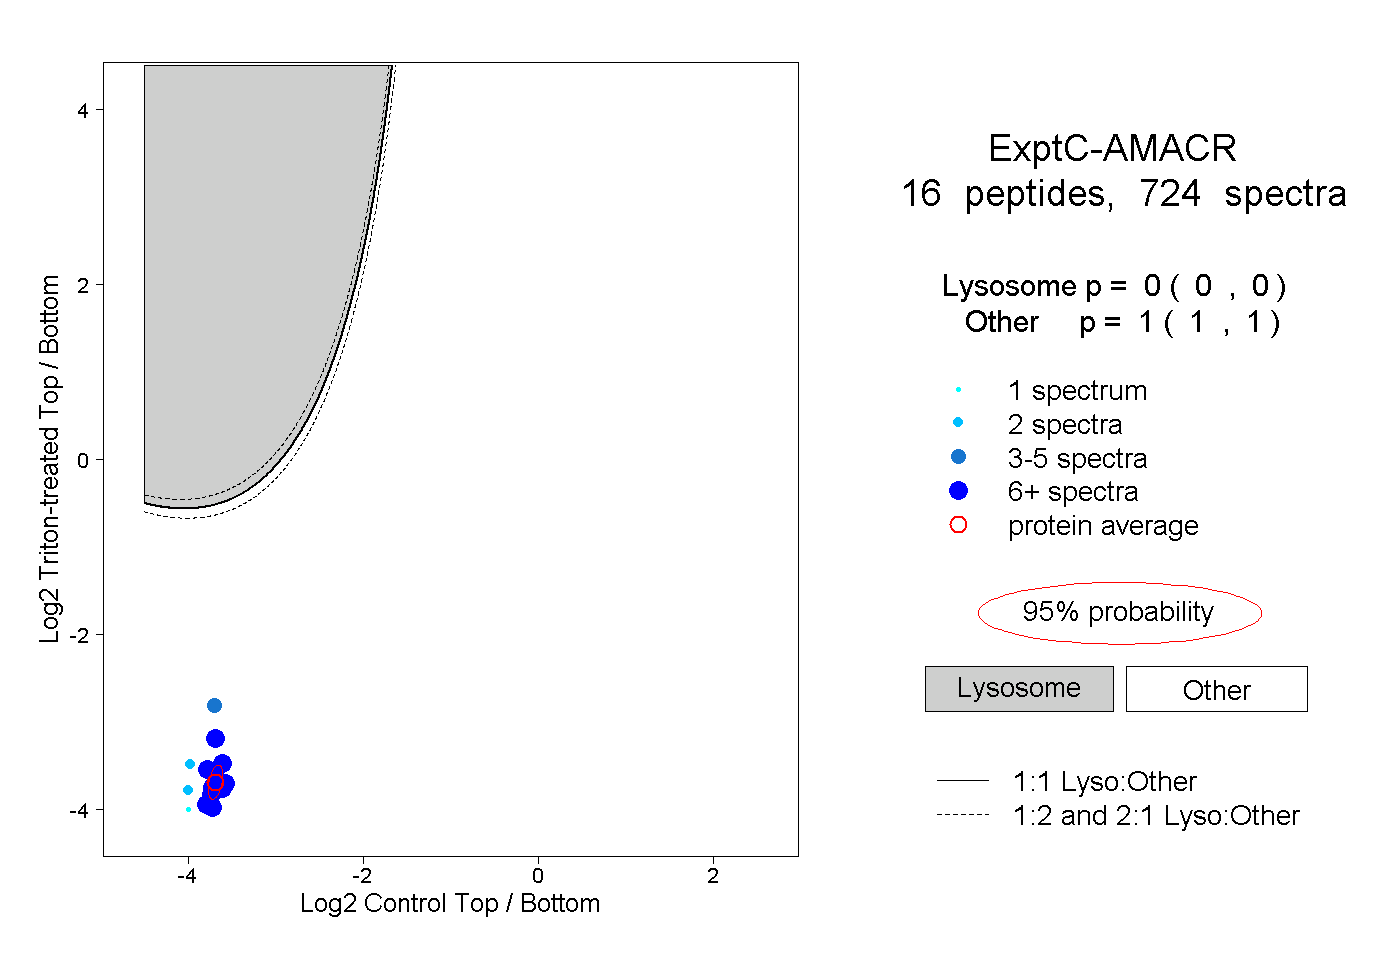
0.000 | 0.000
1.000 | 1.000