 12
12peptides
spectra
0.703 | 0.715
0.000 | 0.000
0.253 | 0.264
0.000 | 0.000
0.000 | 0.000
0.000 | 0.000
0.029 | 0.034
0.000 | 0.000
| Plot | Mito | Lyso | Perox | ER | Golgi | PM | Cytosol | Nucleus | |||||
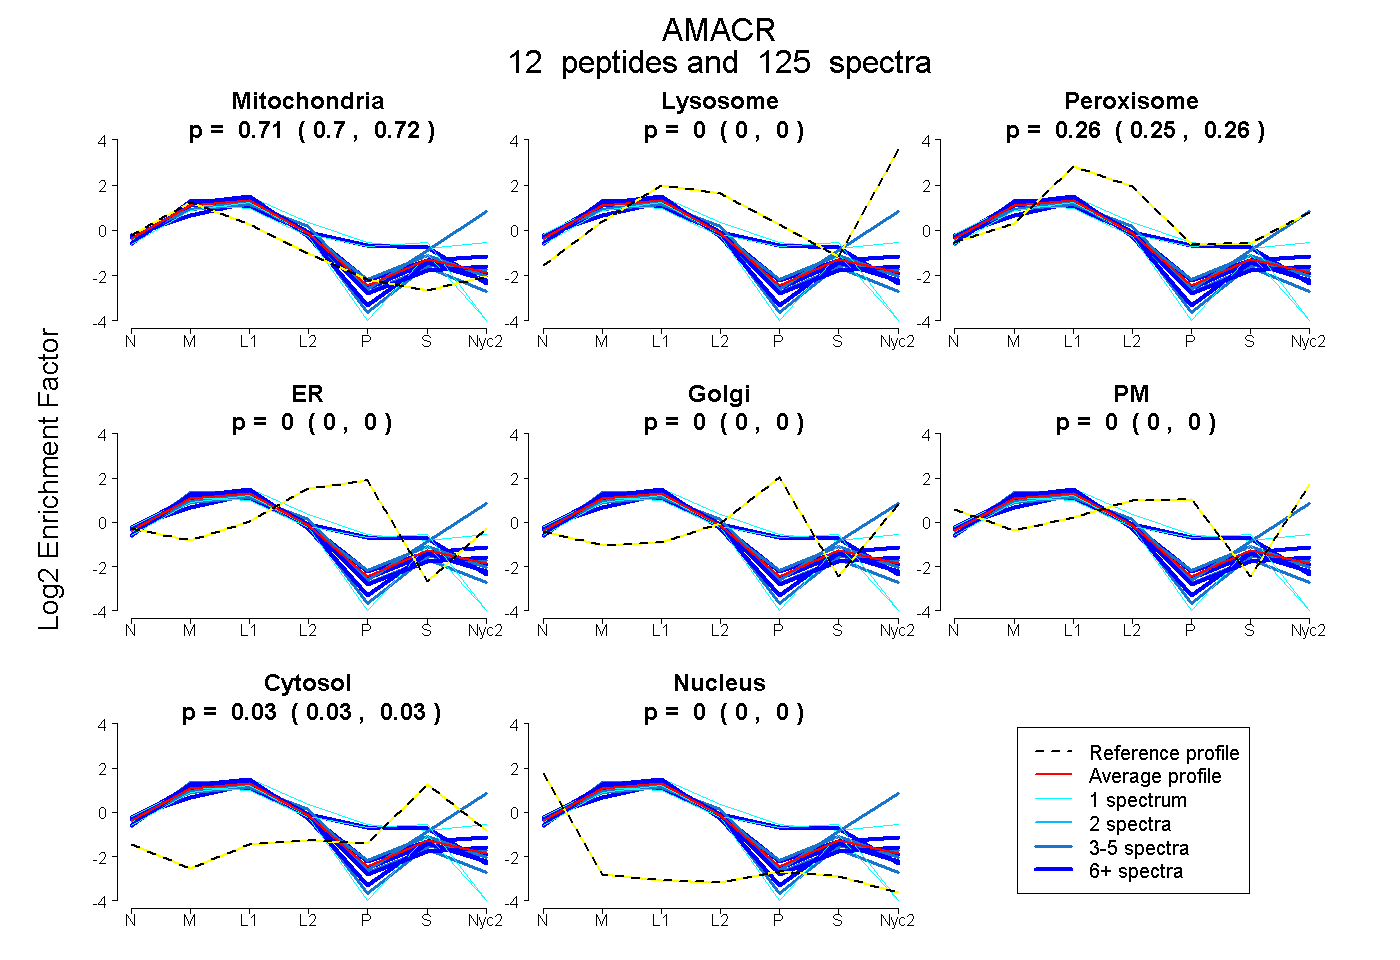
| Expt A |
12 peptides |
125 spectra |
|
0.710 0.703 | 0.715 |
0.000 0.000 | 0.000 |
0.259 0.253 | 0.264 |
0.000 0.000 | 0.000 |
0.000 0.000 | 0.000 |
0.000 0.000 | 0.000 |
0.032 0.029 | 0.034 |
0.000 0.000 | 0.000 |
| 4 spectra, SLALDLK | 0.803 | 0.000 | 0.197 | 0.000 | 0.000 | 0.000 | 0.000 | 0.000 | ||
| 29 spectra, TQAMGLWAQPR | 0.750 | 0.000 | 0.250 | 0.000 | 0.000 | 0.000 | 0.000 | 0.000 | ||
| 1 spectrum, VAGHDINYVALSGVLSK | 0.697 | 0.000 | 0.144 | 0.017 | 0.000 | 0.000 | 0.142 | 0.000 | ||
| 1 spectrum, TADGEFMAVGAIEPQFYTLLLK | 0.962 | 0.000 | 0.000 | 0.000 | 0.000 | 0.000 | 0.038 | 0.000 | ||
| 33 spectra, SPGAAVLR | 0.817 | 0.000 | 0.183 | 0.000 | 0.000 | 0.000 | 0.000 | 0.000 | ||
| 3 spectra, LSGFGQSGIFSK | 0.435 | 0.252 | 0.228 | 0.000 | 0.000 | 0.000 | 0.085 | 0.000 | ||
| 8 spectra, DYGFSQEEIHQLHSDR | 0.538 | 0.000 | 0.284 | 0.049 | 0.000 | 0.000 | 0.128 | 0.000 | ||
| 20 spectra, ADVLLEPFR | 0.745 | 0.000 | 0.255 | 0.000 | 0.000 | 0.000 | 0.000 | 0.000 | ||
| 3 spectra, IIESNK | 0.848 | 0.000 | 0.152 | 0.000 | 0.000 | 0.000 | 0.000 | 0.000 | ||
| 18 spectra, FADVFAR | 0.646 | 0.000 | 0.313 | 0.000 | 0.000 | 0.000 | 0.041 | 0.000 | ||
| 4 spectra, GQNLLDGGAPFYTTYK | 0.685 | 0.000 | 0.243 | 0.000 | 0.000 | 0.000 | 0.073 | 0.000 | ||
| 1 spectrum, CGVMEK | 0.349 | 0.000 | 0.533 | 0.000 | 0.060 | 0.000 | 0.058 | 0.000 |
| Plot | Mito | Lyso or Perox | ER | Golgi | PM | Cytosol | Nucleus | ||||||
| Expt B |
12 peptides |
137 spectra |
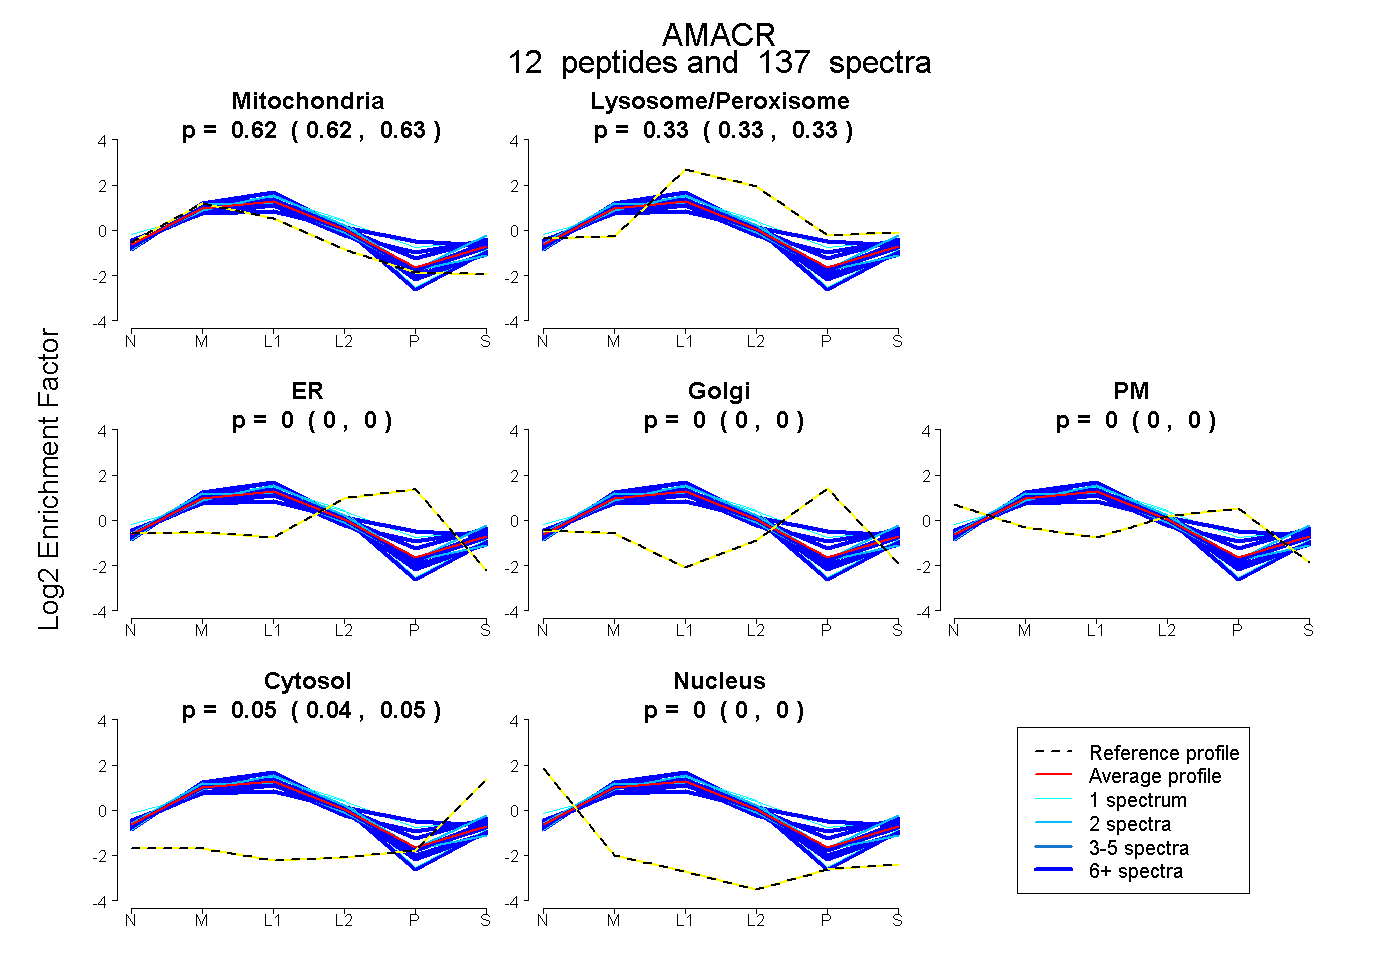 |
0.623 0.619 | 0.627 |
0.330 0.327 | 0.333 |
0.000 0.000 | 0.000 |
0.000 0.000 | 0.000 |
0.000 0.000 | 0.000 |
0.047 0.044 | 0.049 |
0.000 0.000 | 0.000 |
|||
| Plot | Lyso | Other | |||||||||||
| Expt C |
16 peptides |
724 spectra |
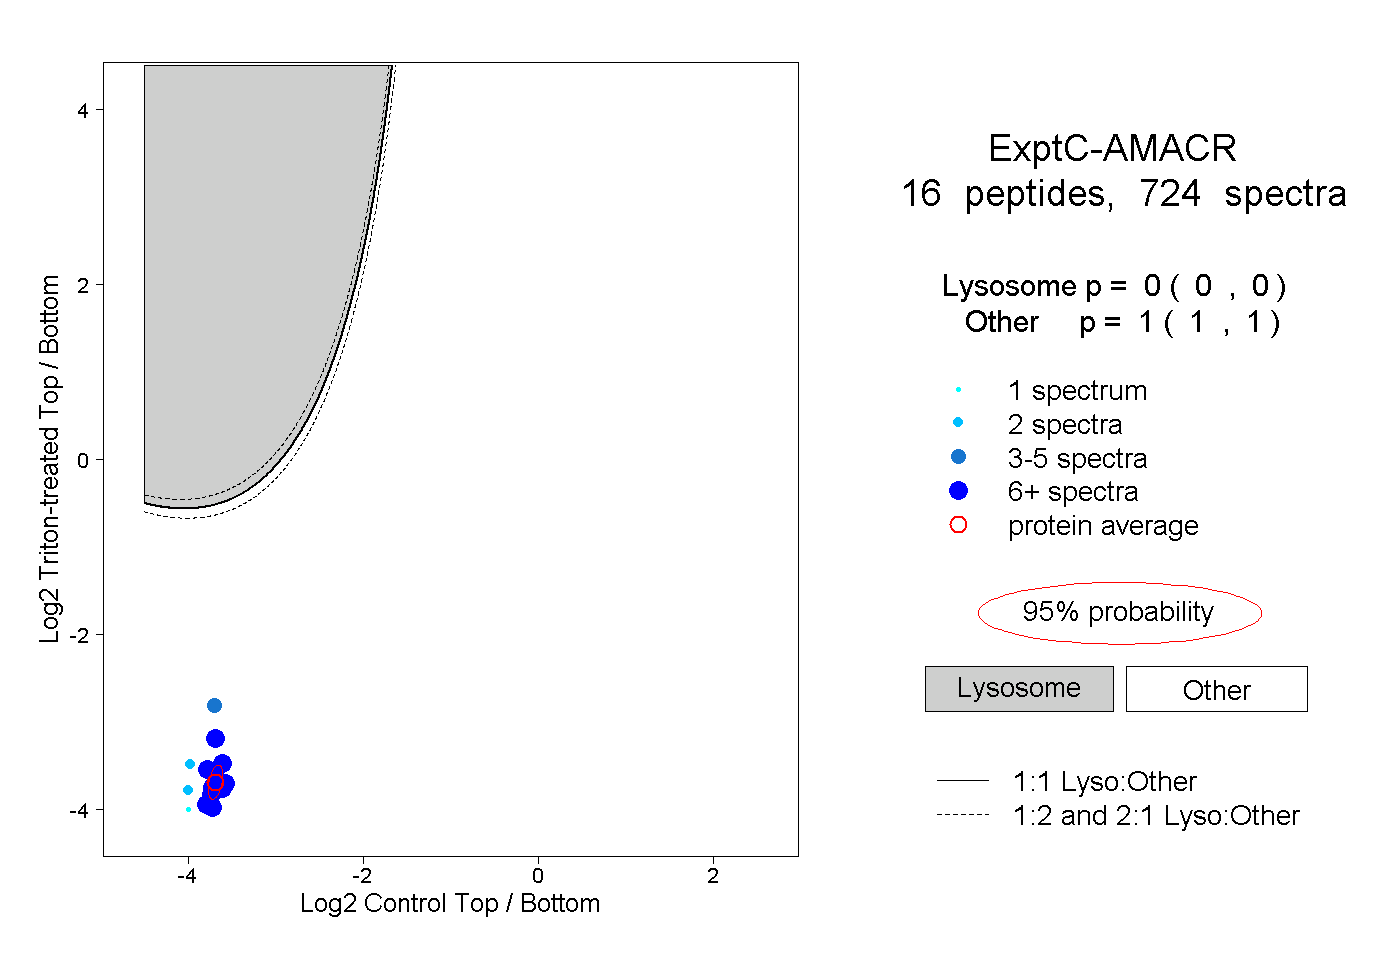 |
0.000 0.000 | 0.000 |
1.000 1.000 | 1.000 |
||||||||
| Plot | Lyso | Other | |||||||||||
| Expt D |
15 peptides |
70 spectra |
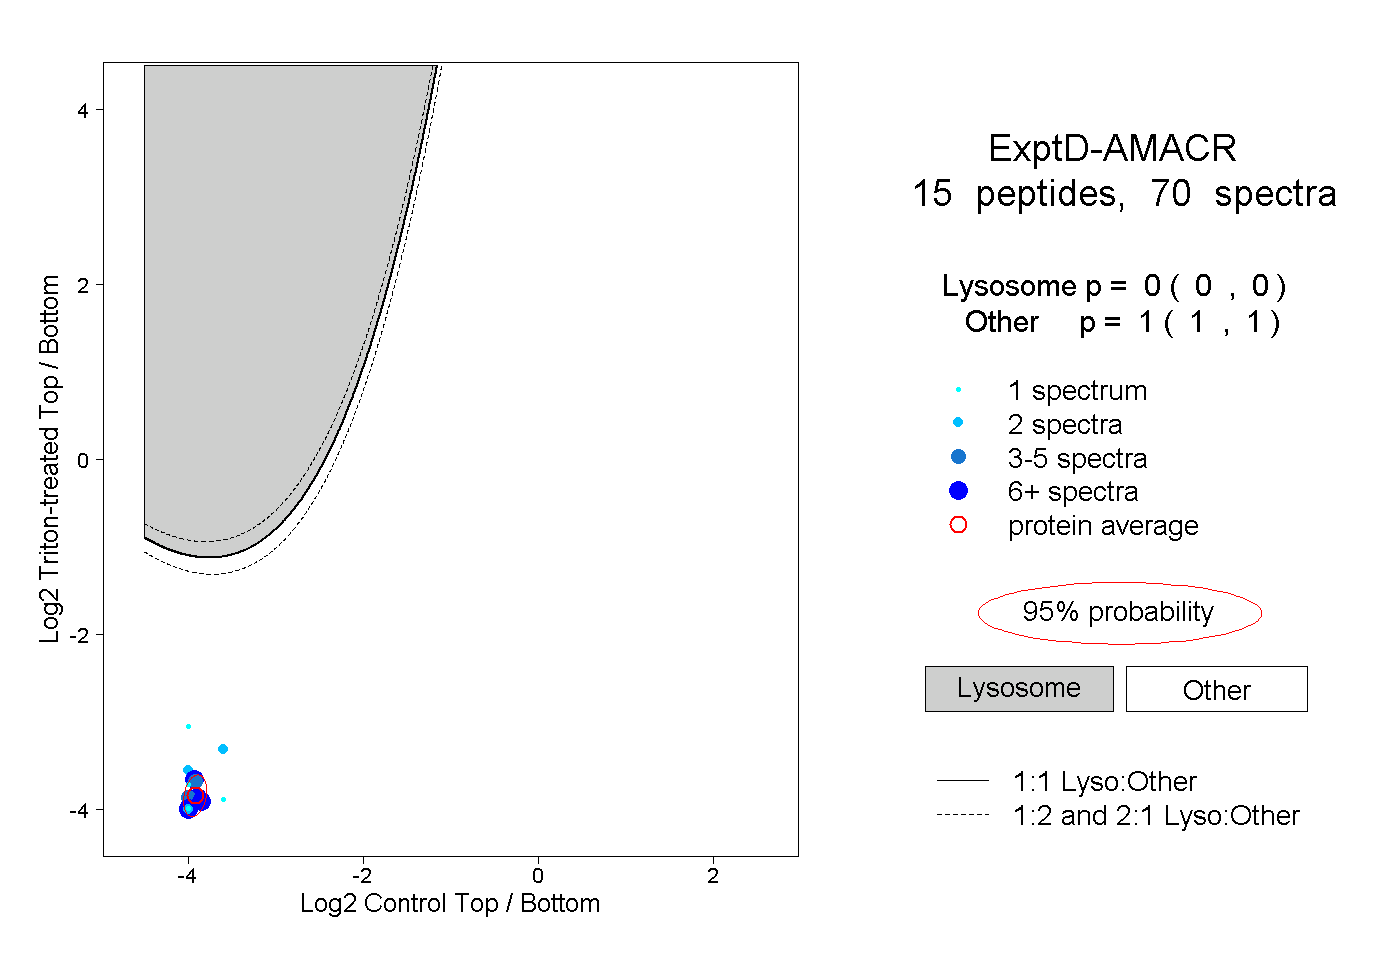 |
0.000 0.000 | 0.000 |
1.000 1.000 | 1.000 |