32
32peptides
spectra
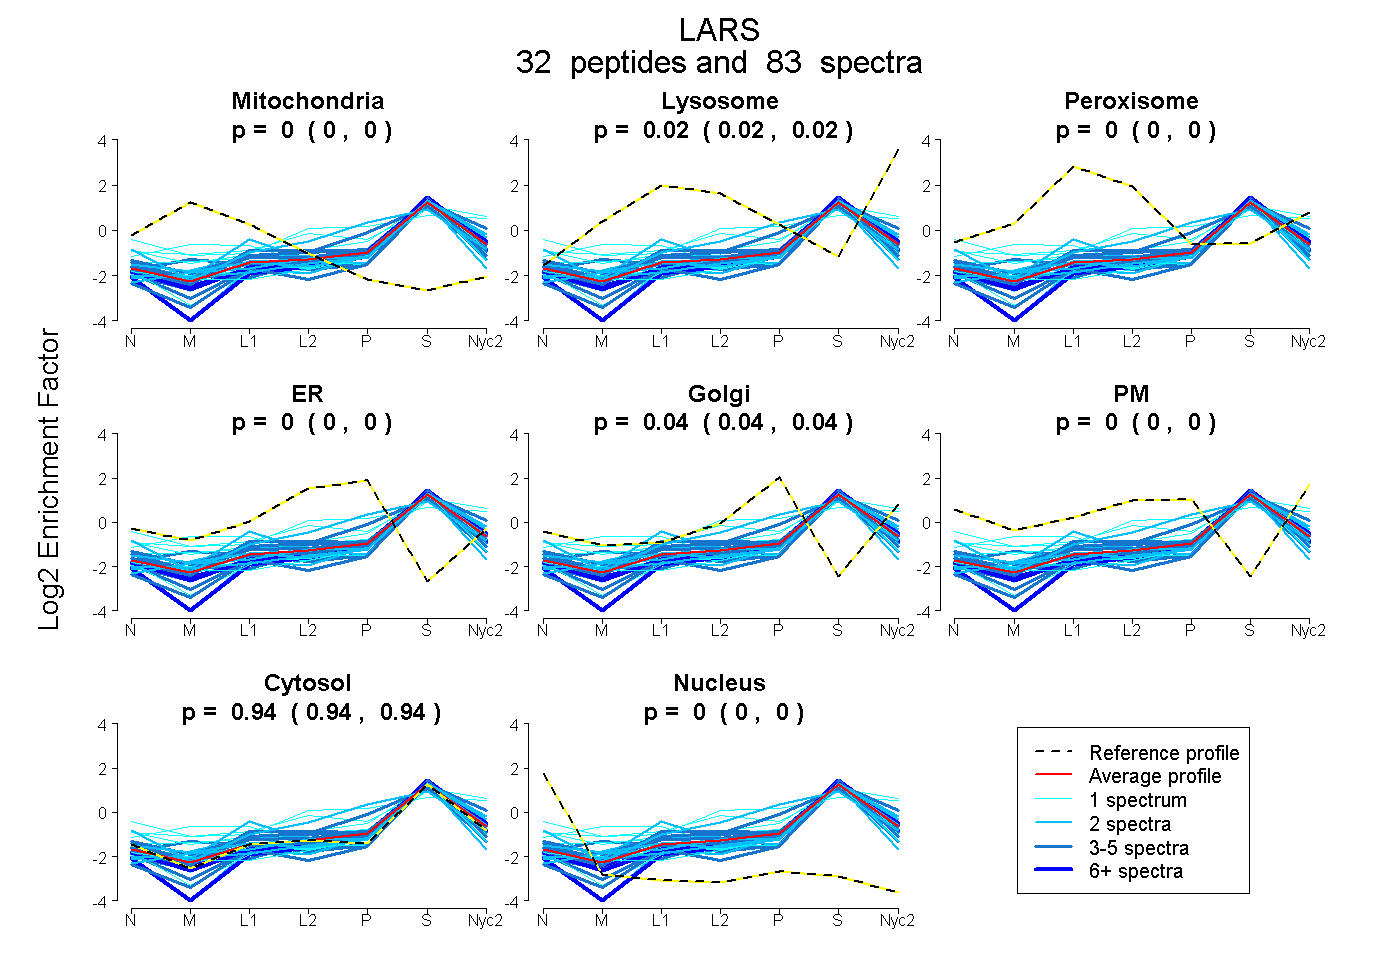
0.000 | 0.000
0.016 | 0.022
0.000 | 0.000
0.000 | 0.000
0.036 | 0.042
0.000 | 0.000
0.938 | 0.943
0.000 | 0.000
9peptides
spectra
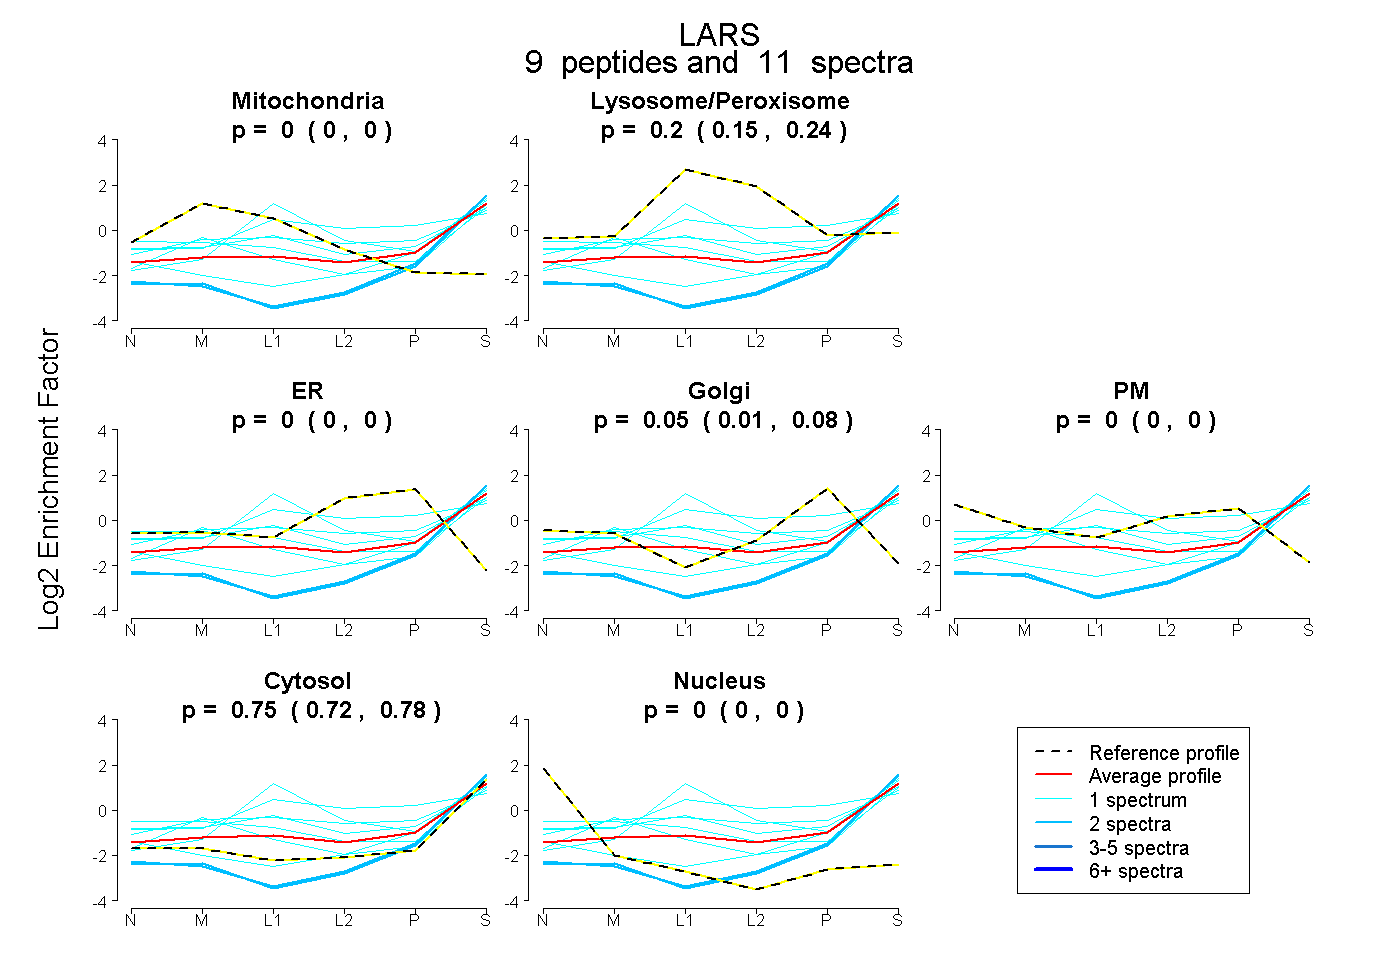
0.000 | 0.000
0.146 | 0.236
0.000 | 0.000
0.014 | 0.084
0.000 | 0.000
0.725 | 0.776
0.000 | 0.000