 14
14peptides
spectra
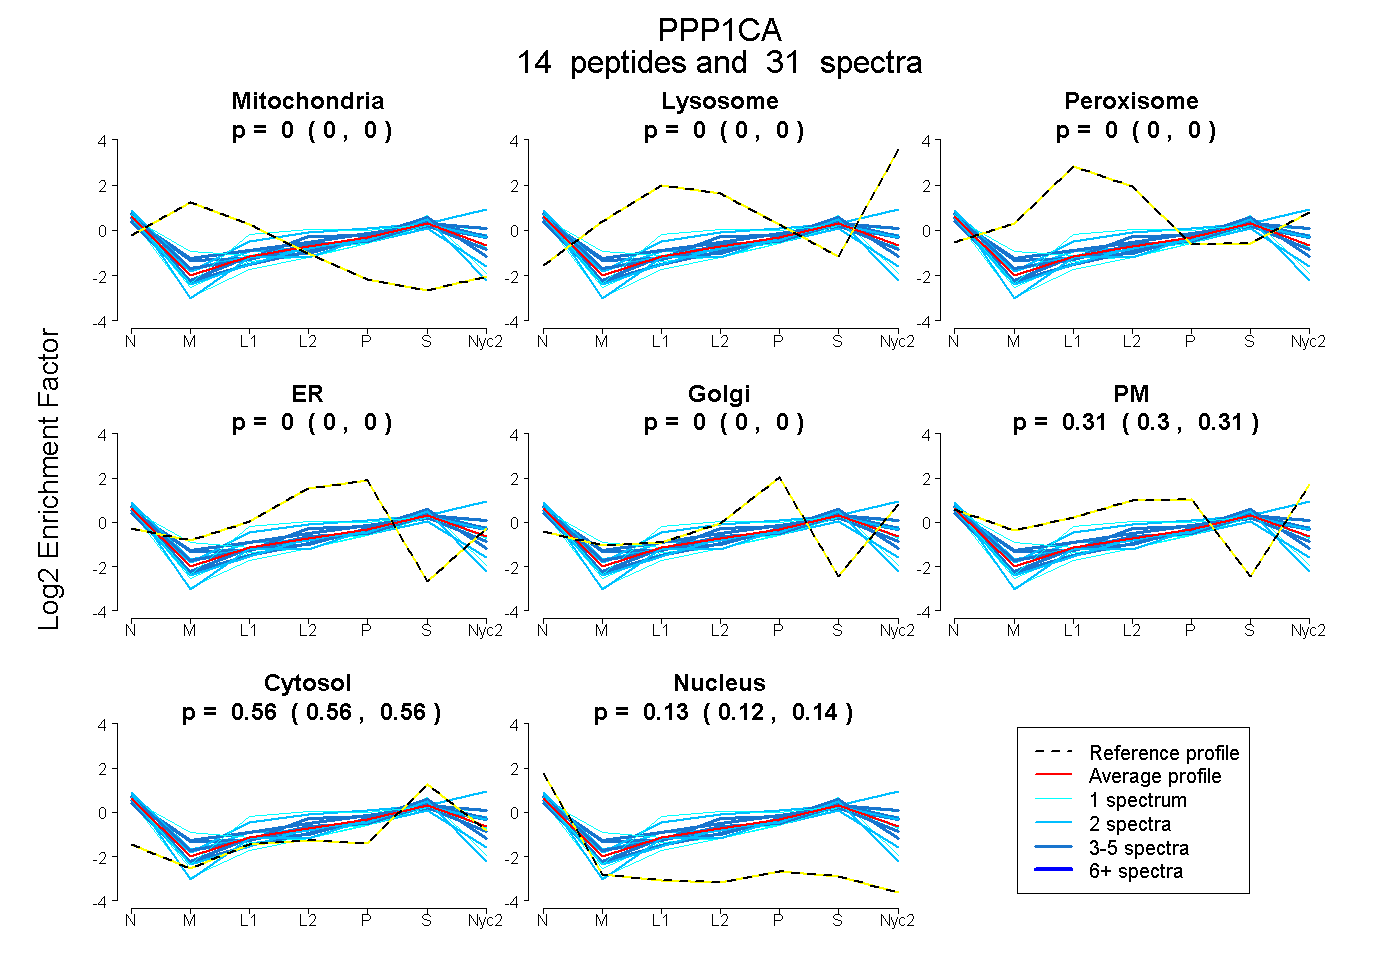
0.000 | 0.000
0.000 | 0.000
0.000 | 0.000
0.000 | 0.004
0.000 | 0.000
0.296 | 0.313
0.558 | 0.564
0.124 | 0.136
7peptides
spectra
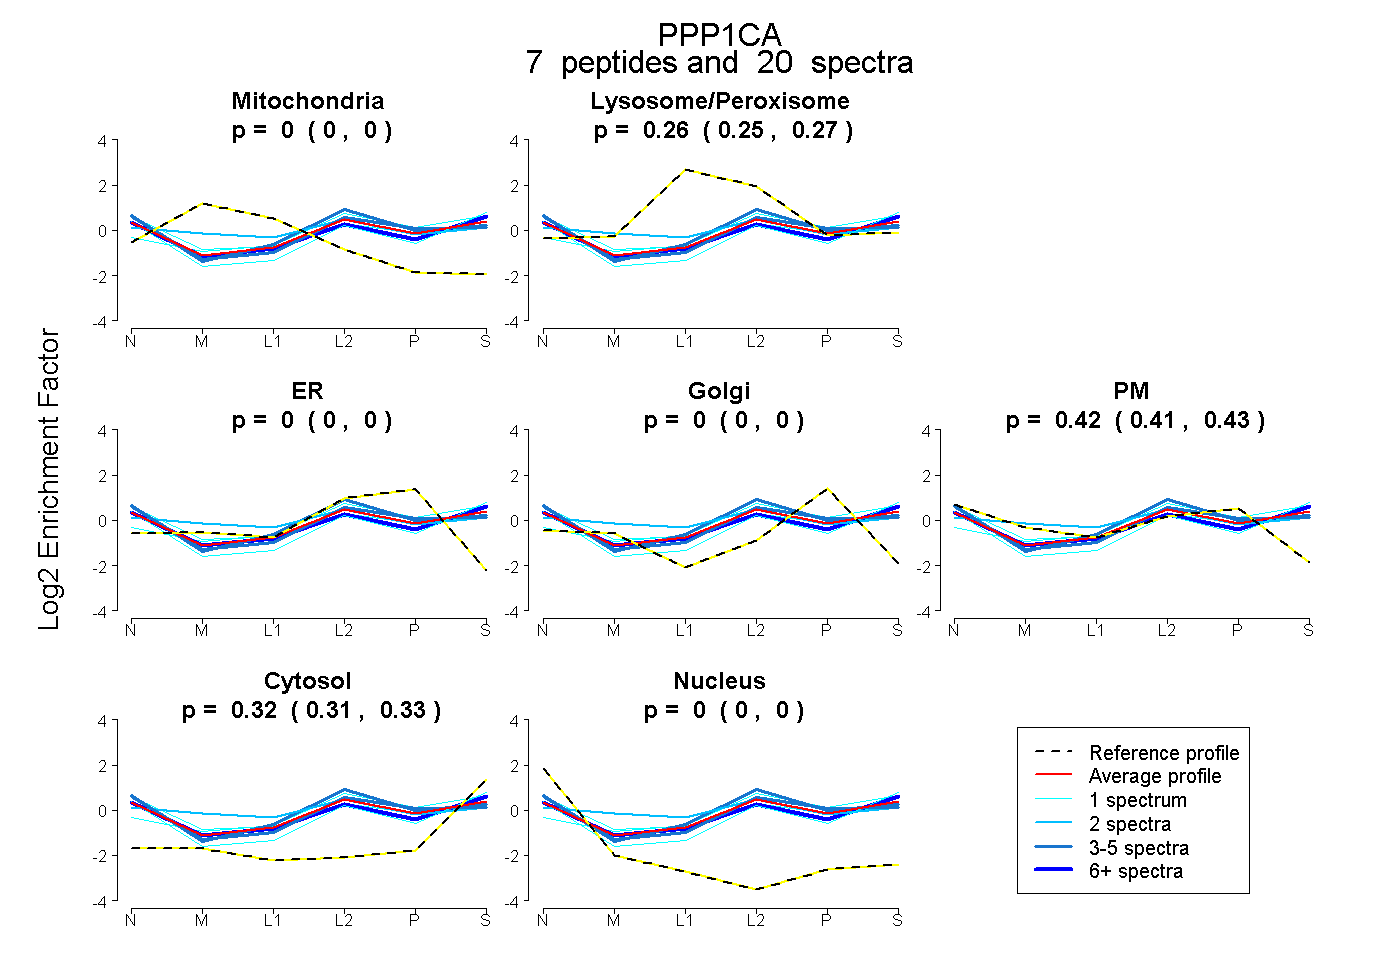
0.000 | 0.000
0.245 | 0.267
0.000 | 0.000
0.000 | 0.000
0.408 | 0.434
0.312 | 0.329
0.000 | 0.000
6peptides
spectra

0.000 | 0.000
1.000 | 1.000
1peptide
spectra
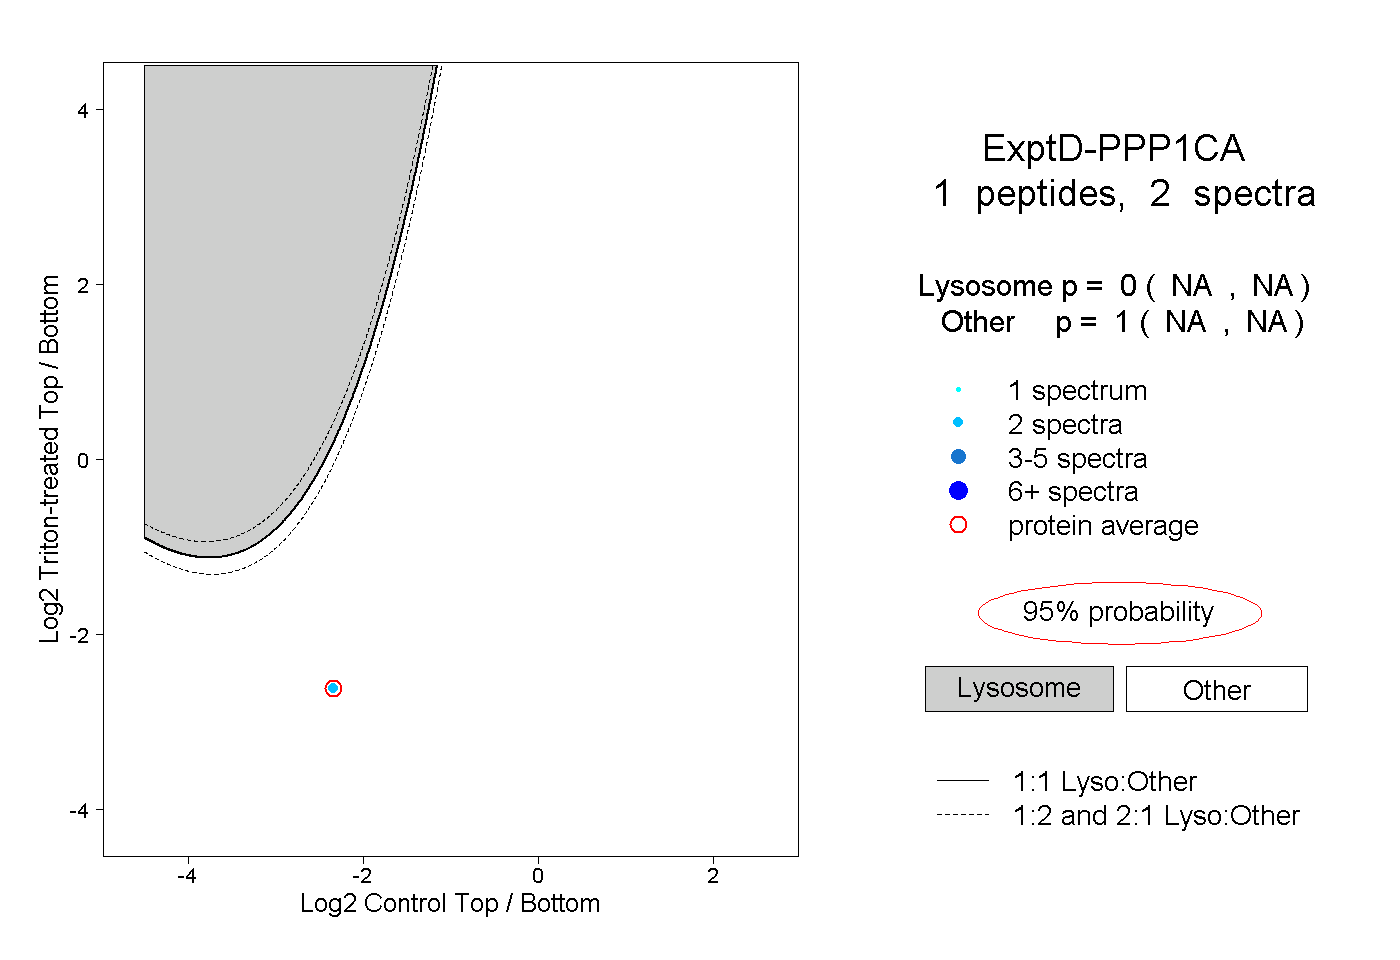
NA | NA
NA | NA