ASGR1
[ENSRNOP00000025254]
Main page
| | | Plot |
Mito |
Lyso |
|
Perox |
ER |
Golgi |
PM |
Cytosol |
Nucleus |
|
| Expt A |
 12
12
peptides |
133
spectra |
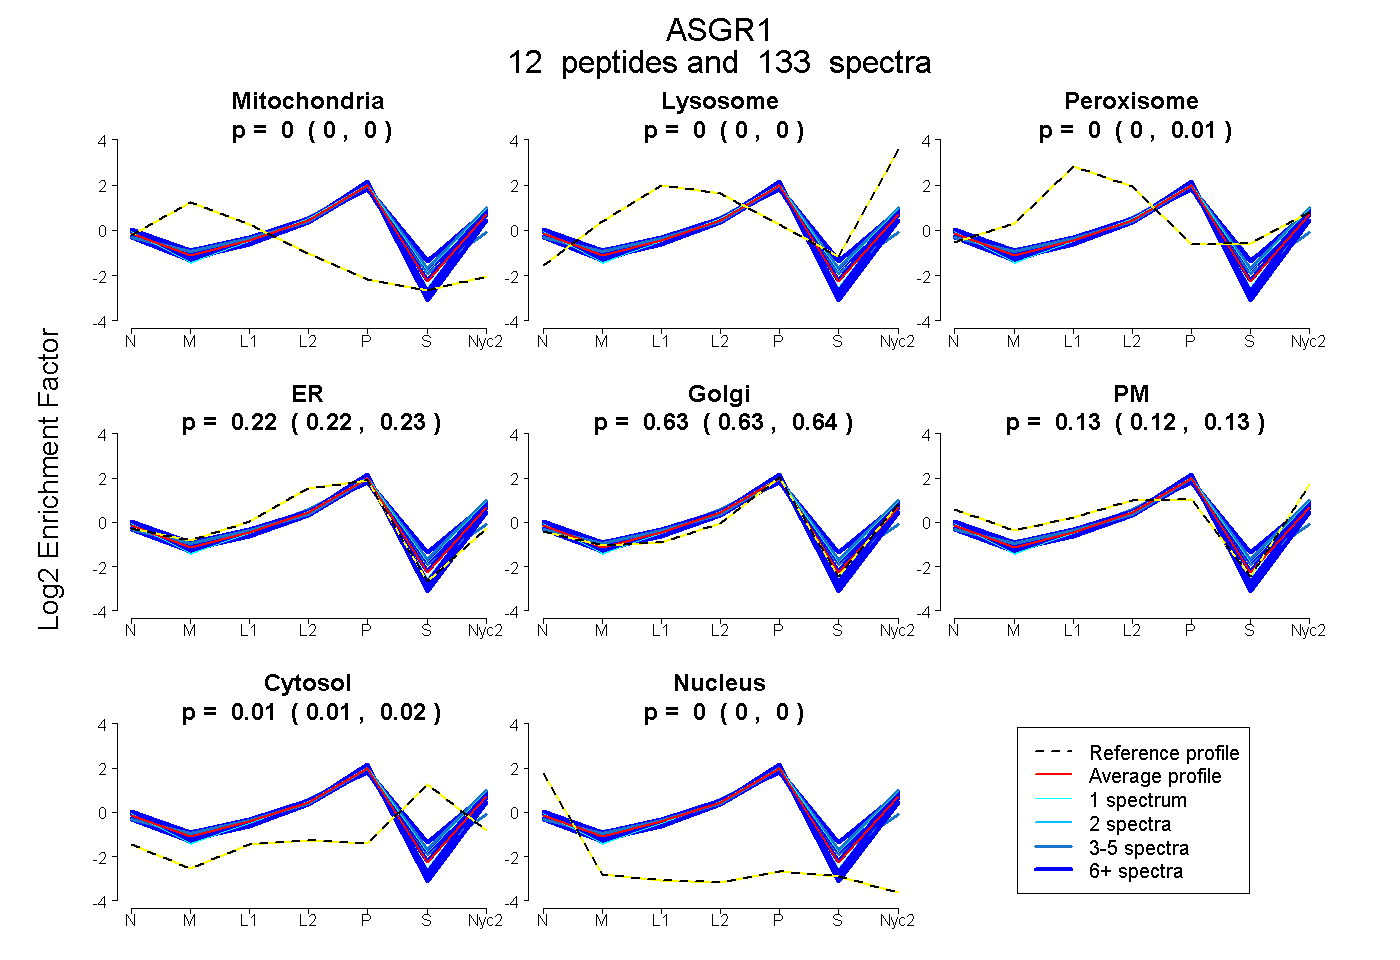 |
0.000
0.000 | 0.000 |
0.000
0.000 | 0.000 |
|
0.002
0.000 | 0.006 |
0.224
0.216 | 0.230 |
0.631
0.626 | 0.638 |
0.128
0.120 | 0.132 |
0.015
0.012 | 0.018 |
0.000
0.000 | 0.000 |
|
| | | Plot |
Mito |
|
Lyso or Perox |
|
ER |
Golgi |
PM |
Cytosol |
Nucleus |
|
| Expt B |
9
peptides |
35
spectra |
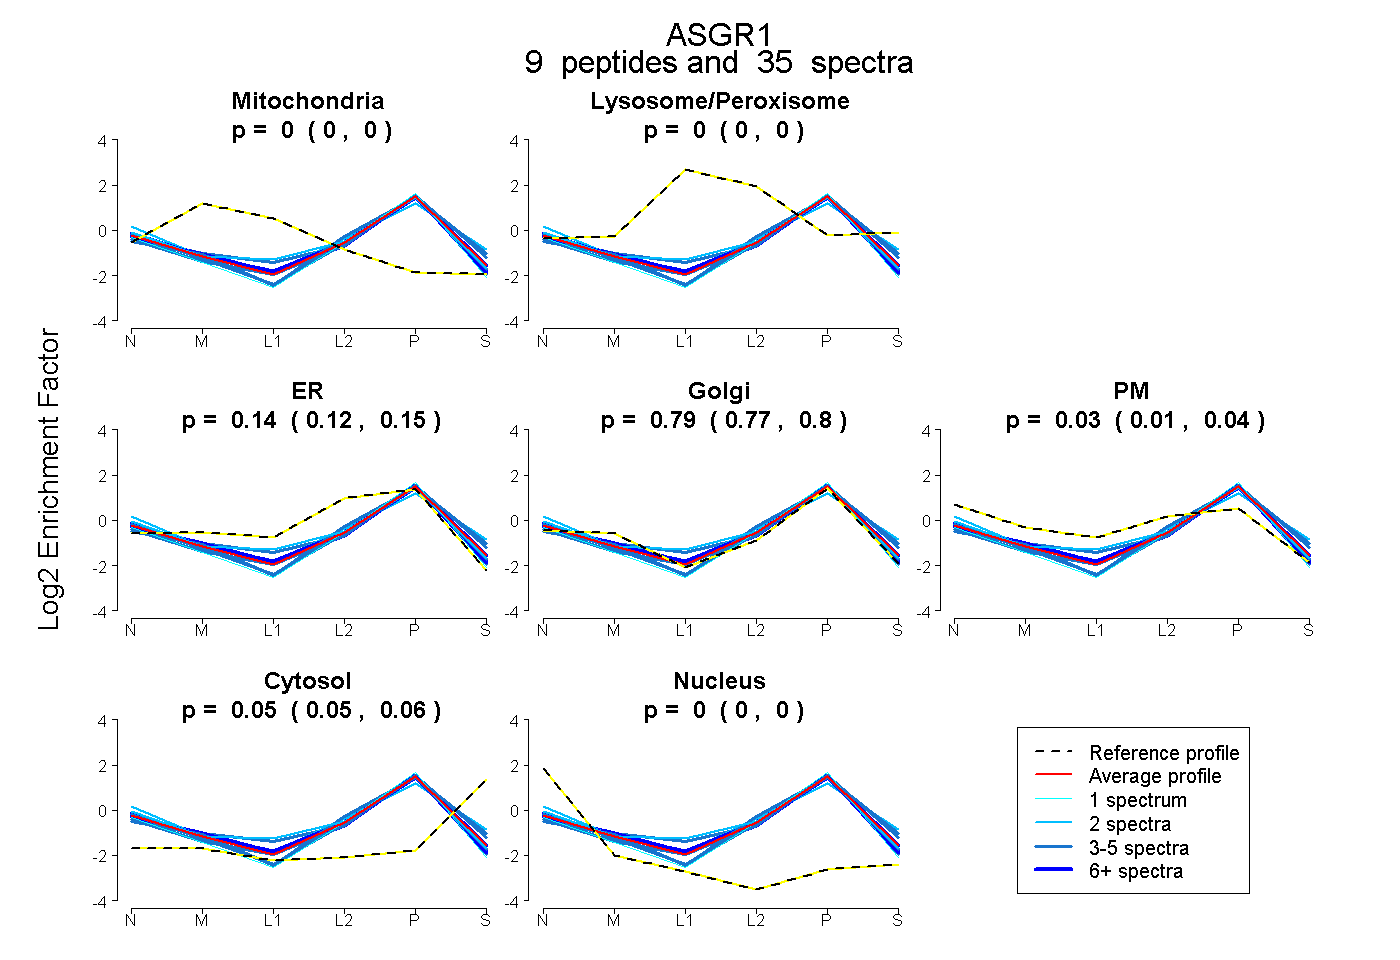 |
0.000
0.000 | 0.000 |
|
0.000
0.000 | 0.000 |
|
0.135
0.122 | 0.147 |
0.787
0.769 | 0.802 |
0.026
0.011 | 0.038 |
0.052
0.045 | 0.058 |
0.000
0.000 | 0.000 |
|
| 5 spectra, QLVSDVR |
0.000 |
|
0.000 |
|
0.022 |
0.955 |
0.000 |
0.010 |
0.014 |
|
| 1 spectrum, WVDGTDYETGFK |
0.000 |
|
0.000 |
|
0.003 |
0.997 |
0.000 |
0.000 |
0.000 |
|
| 3 spectra, LLLHVK |
0.000 |
|
0.000 |
|
0.116 |
0.772 |
0.000 |
0.112 |
0.000 |
|
| 8 spectra, GPPPAPR |
0.000 |
|
0.001 |
|
0.141 |
0.841 |
0.000 |
0.000 |
0.018 |
|
| 2 spectra, LCSGFR |
0.000 |
|
0.001 |
|
0.037 |
0.499 |
0.319 |
0.145 |
0.000 |
|
| 6 spectra, LVESQLEK |
0.000 |
|
0.012 |
|
0.095 |
0.773 |
0.081 |
0.038 |
0.000 |
|
| 5 spectra, SLSCQMAALR |
0.000 |
|
0.000 |
|
0.142 |
0.731 |
0.000 |
0.127 |
0.000 |
|
| 3 spectra, ALTTQGER |
0.000 |
|
0.051 |
|
0.145 |
0.785 |
0.000 |
0.000 |
0.018 |
|
| 2 spectra, WVCETELGK |
0.000 |
|
0.101 |
|
0.086 |
0.740 |
0.055 |
0.000 |
0.019 |
|
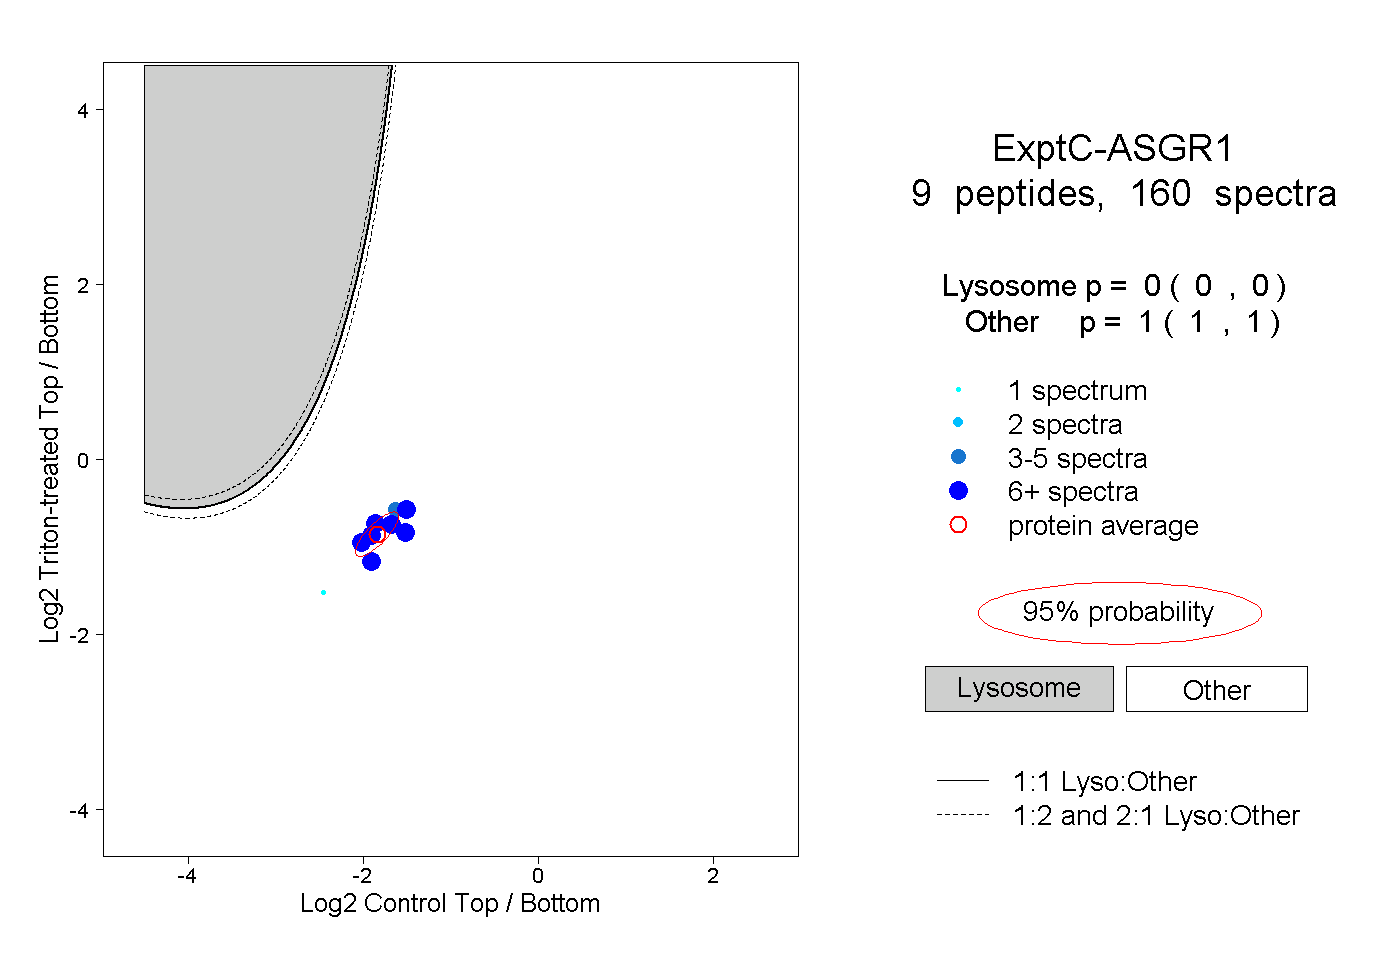
| | | Plot |
|
Lyso |
|
|
|
|
|
|
|
Other |
| Expt C |
9
peptides |
160
spectra |
 |
|
0.000
0.000 | 0.000 |
|
|
|
|
|
|
|
1.000
1.000 | 1.000 |
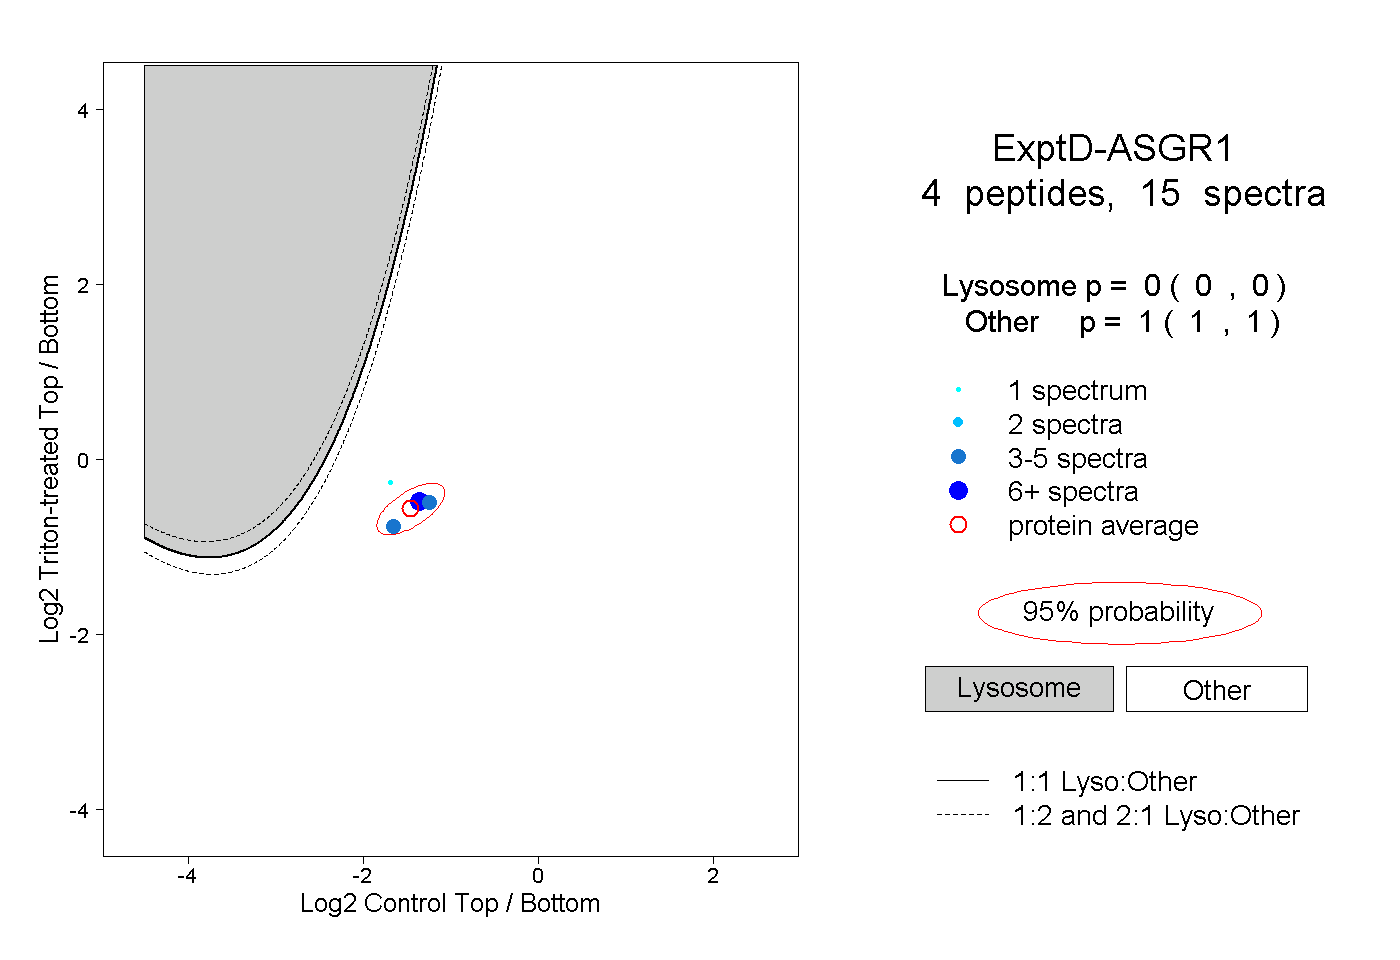
| | | Plot |
|
Lyso |
|
|
|
|
|
|
|
Other |
| Expt D |
4
peptides |
15
spectra |
 |
|
0.000
0.000 | 0.000 |
|
|
|
|
|
|
|
1.000
1.000 | 1.000 |