 12
12peptides
spectra
0.000 | 0.000
0.000 | 0.000
0.000 | 0.006
0.216 | 0.230
0.626 | 0.638
0.120 | 0.132
0.012 | 0.018
0.000 | 0.000
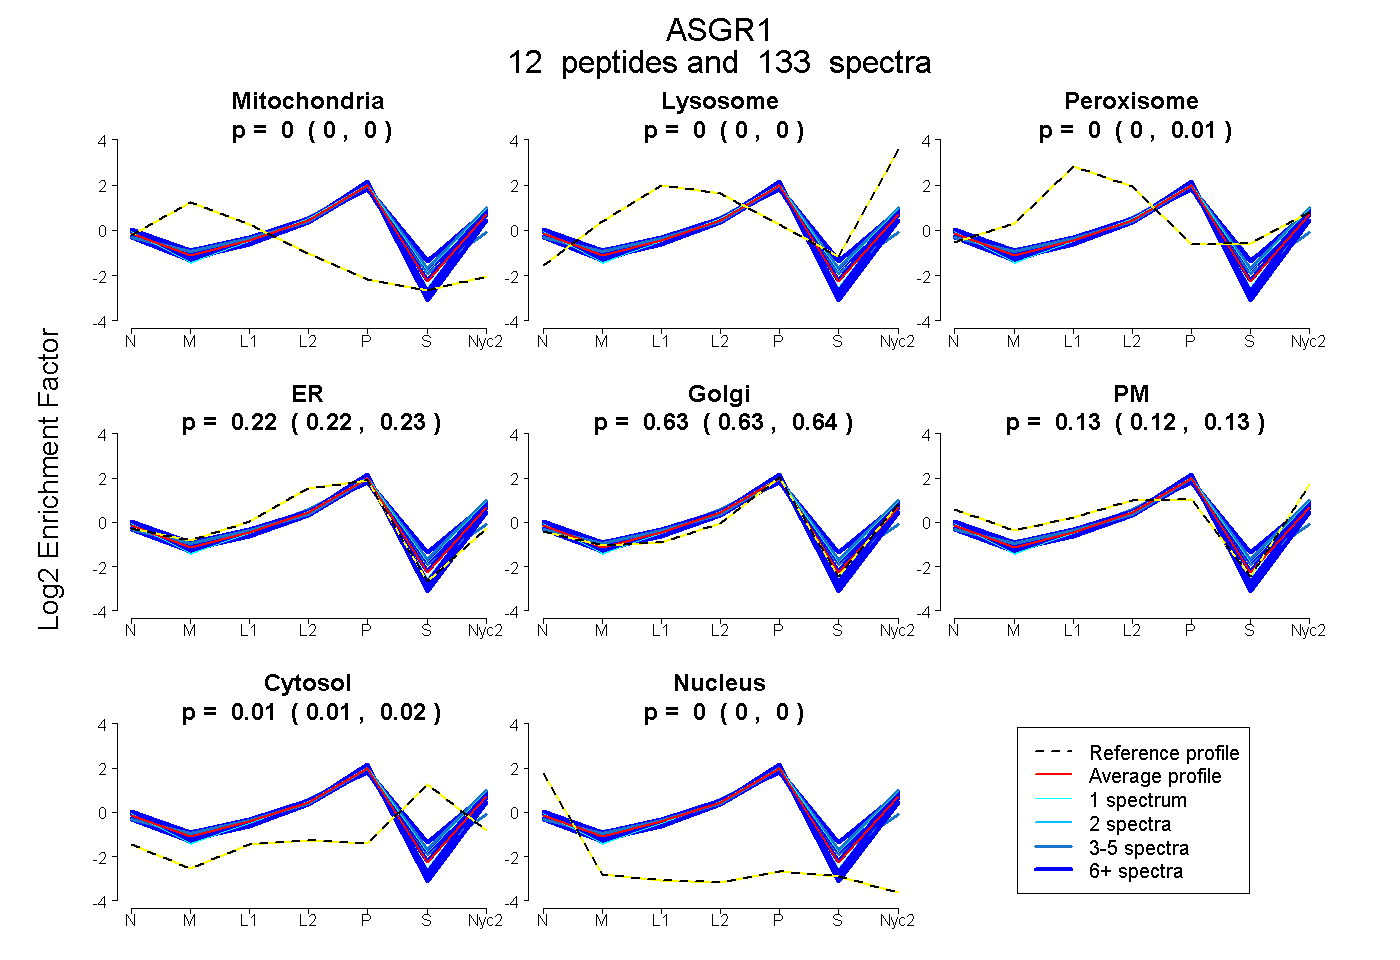
| Plot | Mito | Lyso | Perox | ER | Golgi | PM | Cytosol | Nucleus | |||||
| Expt A |
12 peptides |
133 spectra |
|
0.000 0.000 | 0.000 |
0.000 0.000 | 0.000 |
0.002 0.000 | 0.006 |
0.224 0.216 | 0.230 |
0.631 0.626 | 0.638 |
0.128 0.120 | 0.132 |
0.015 0.012 | 0.018 |
0.000 0.000 | 0.000 |
| 13 spectra, QLVSDVR | 0.000 | 0.000 | 0.000 | 0.191 | 0.621 | 0.188 | 0.000 | 0.000 | ||
| 3 spectra, WVDGTDYETGFK | 0.000 | 0.069 | 0.083 | 0.028 | 0.797 | 0.002 | 0.021 | 0.000 | ||
| 6 spectra, LLLHVK | 0.000 | 0.046 | 0.000 | 0.175 | 0.608 | 0.032 | 0.140 | 0.000 | ||
| 24 spectra, GPPPAPR | 0.000 | 0.000 | 0.000 | 0.259 | 0.594 | 0.147 | 0.000 | 0.000 | ||
| 4 spectra, LCSGFR | 0.000 | 0.000 | 0.000 | 0.526 | 0.383 | 0.000 | 0.091 | 0.000 | ||
| 1 spectrum, FVQQHMGPLNTWIGLTDQNGPWK | 0.000 | 0.000 | 0.000 | 0.186 | 0.646 | 0.168 | 0.000 | 0.000 | ||
| 16 spectra, LVESQLEK | 0.000 | 0.000 | 0.016 | 0.127 | 0.545 | 0.303 | 0.009 | 0.000 | ||
| 33 spectra, SLSCQMAALR | 0.000 | 0.000 | 0.000 | 0.383 | 0.617 | 0.000 | 0.000 | 0.000 | ||
| 16 spectra, ALTTQGER | 0.000 | 0.000 | 0.000 | 0.194 | 0.696 | 0.110 | 0.000 | 0.000 | ||
| 9 spectra, WVCETELGK | 0.000 | 0.006 | 0.017 | 0.260 | 0.620 | 0.000 | 0.097 | 0.000 | ||
| 7 spectra, HQEDLR | 0.000 | 0.090 | 0.000 | 0.164 | 0.554 | 0.082 | 0.111 | 0.000 | ||
| 1 spectrum, YCQLENAHLVVVTSWEEQR | 0.000 | 0.013 | 0.000 | 0.129 | 0.623 | 0.177 | 0.058 | 0.000 |
| Plot | Mito | Lyso or Perox | ER | Golgi | PM | Cytosol | Nucleus | ||||||
| Expt B |
9 peptides |
35 spectra |
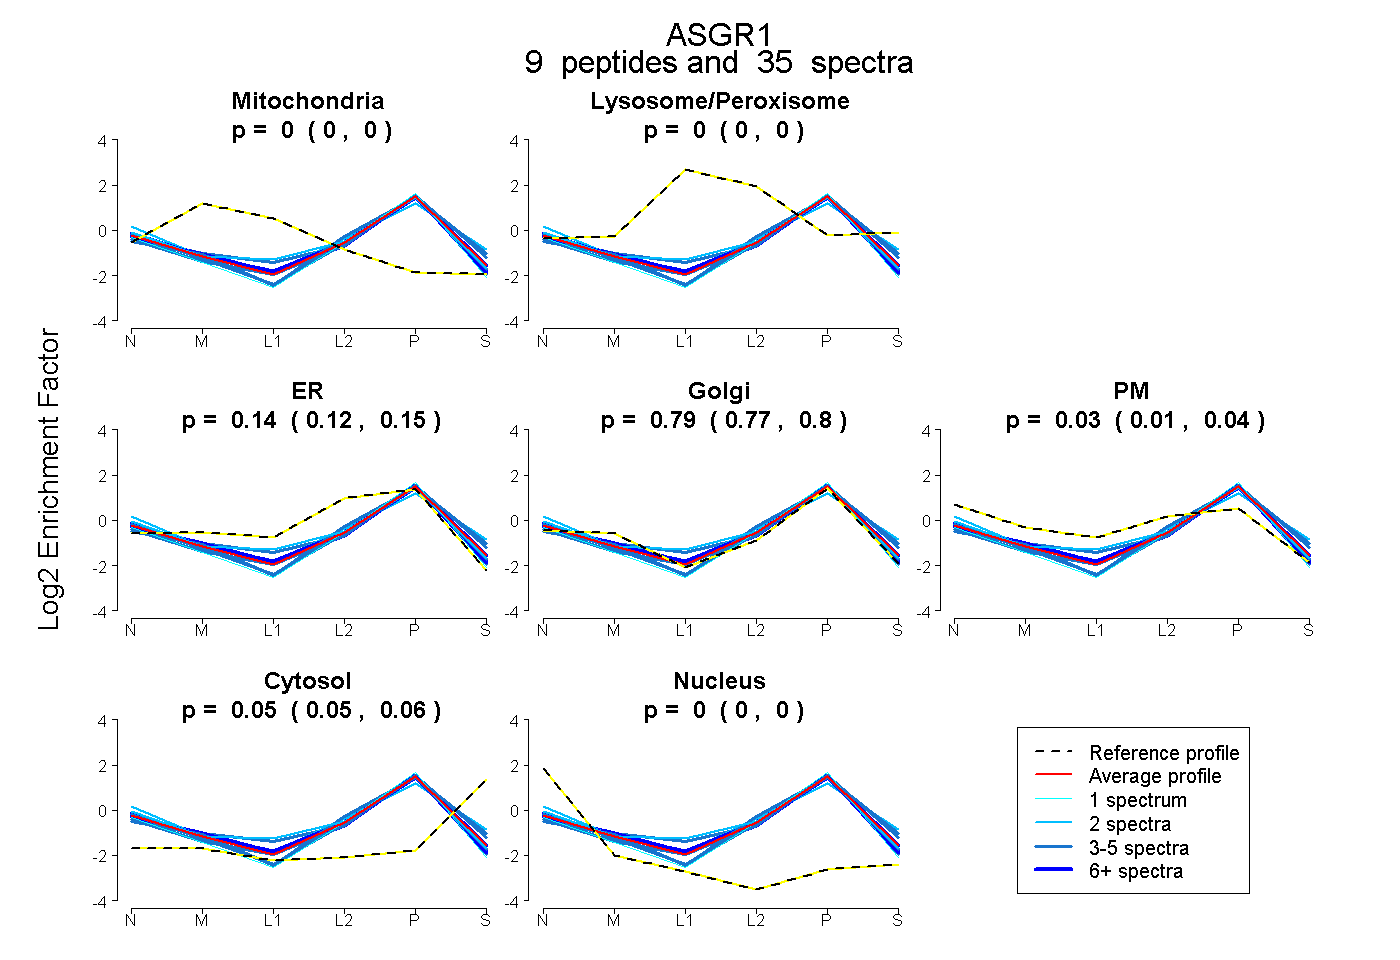 |
0.000 0.000 | 0.000 |
0.000 0.000 | 0.000 |
0.135 0.122 | 0.147 |
0.787 0.769 | 0.802 |
0.026 0.011 | 0.038 |
0.052 0.045 | 0.058 |
0.000 0.000 | 0.000 |
|||
| Plot | Lyso | Other | |||||||||||
| Expt C |
9 peptides |
160 spectra |
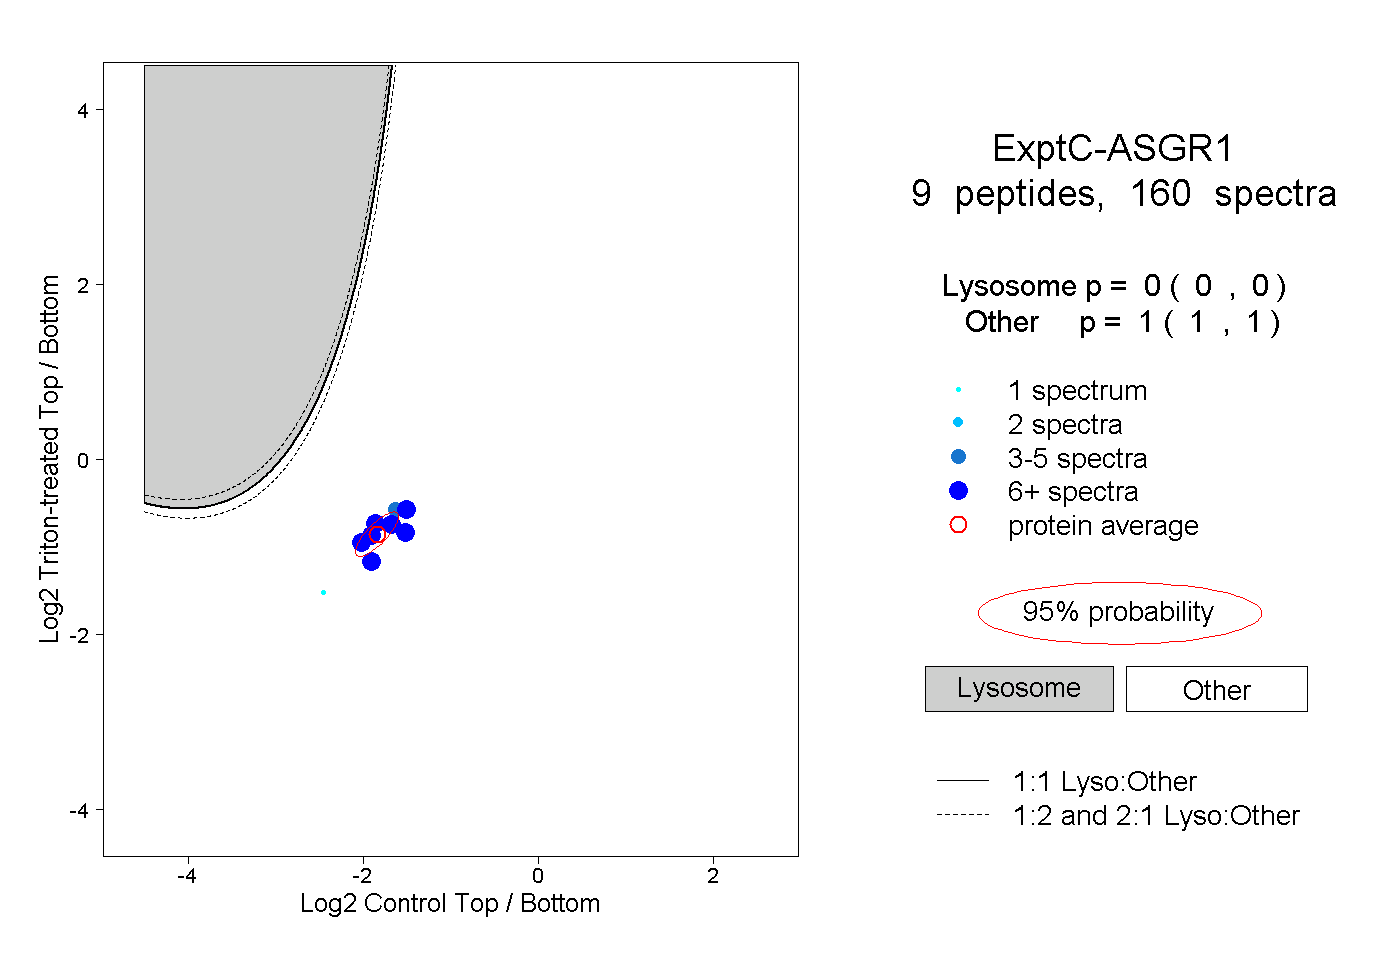 |
0.000 0.000 | 0.000 |
1.000 1.000 | 1.000 |
||||||||
| Plot | Lyso | Other | |||||||||||
| Expt D |
4 peptides |
15 spectra |
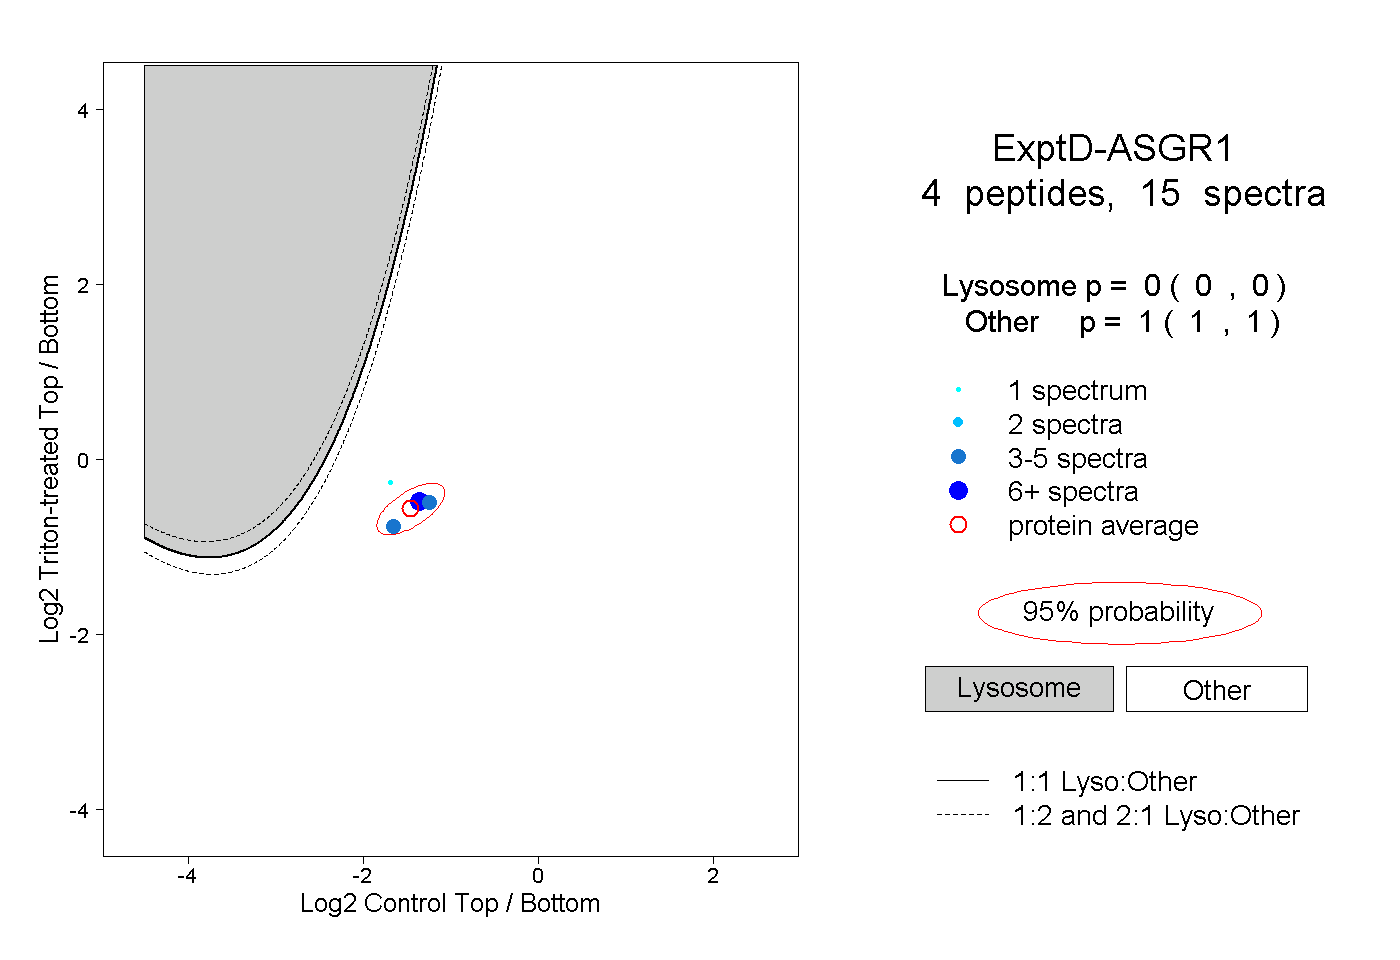 |
0.000 0.000 | 0.000 |
1.000 1.000 | 1.000 |