 1
1peptide
spectra
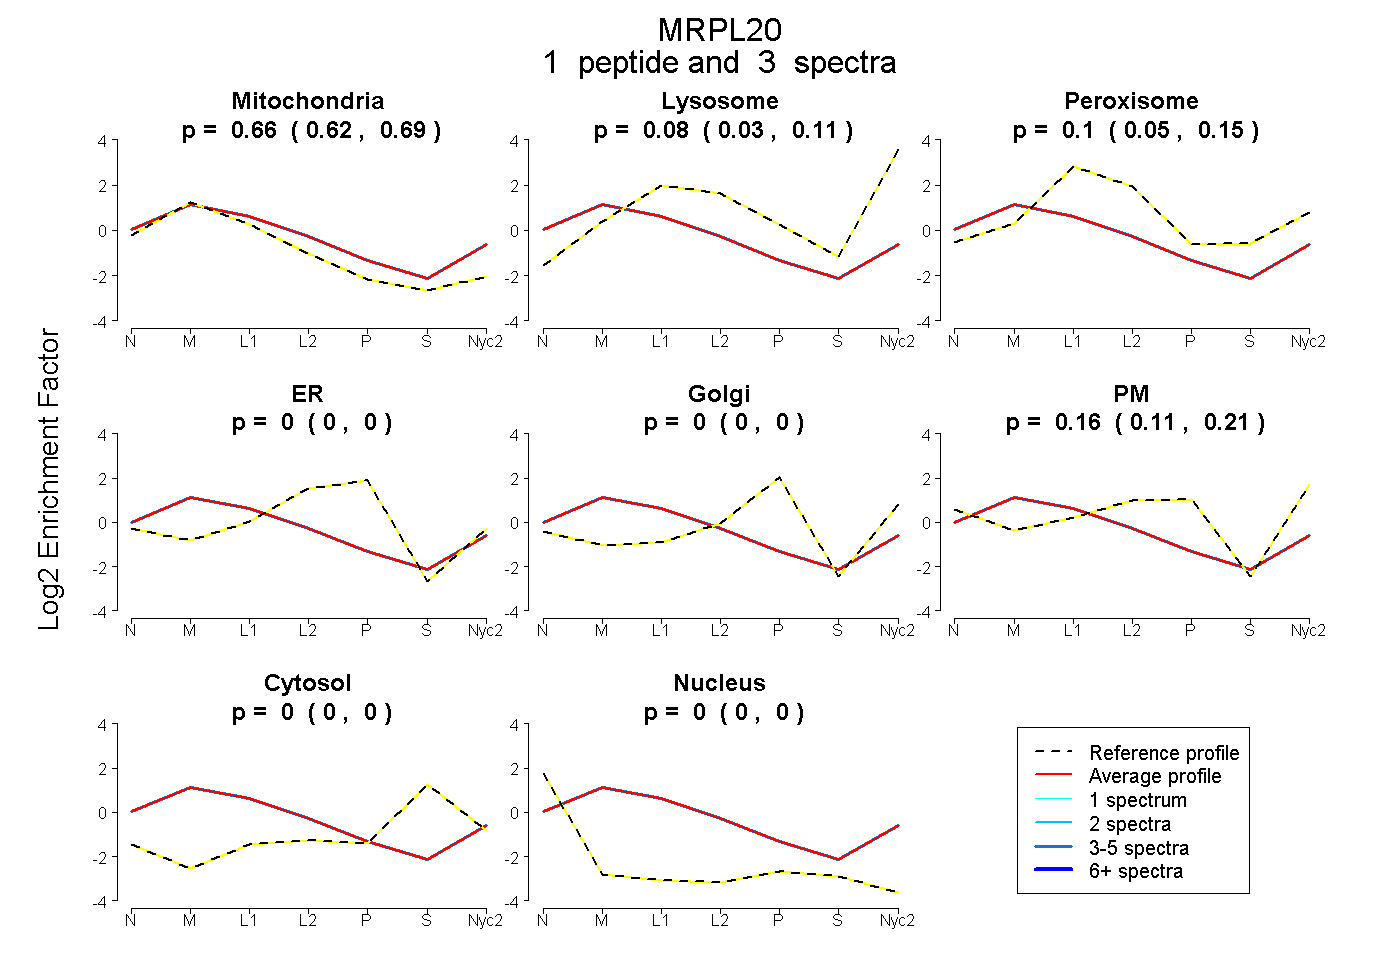
0.623 | 0.691
0.034 | 0.112
0.048 | 0.147
0.000 | 0.000
0.000 | 0.000
0.110 | 0.209
0.000 | 0.003
0.000 | 0.000
1peptide
spectrum
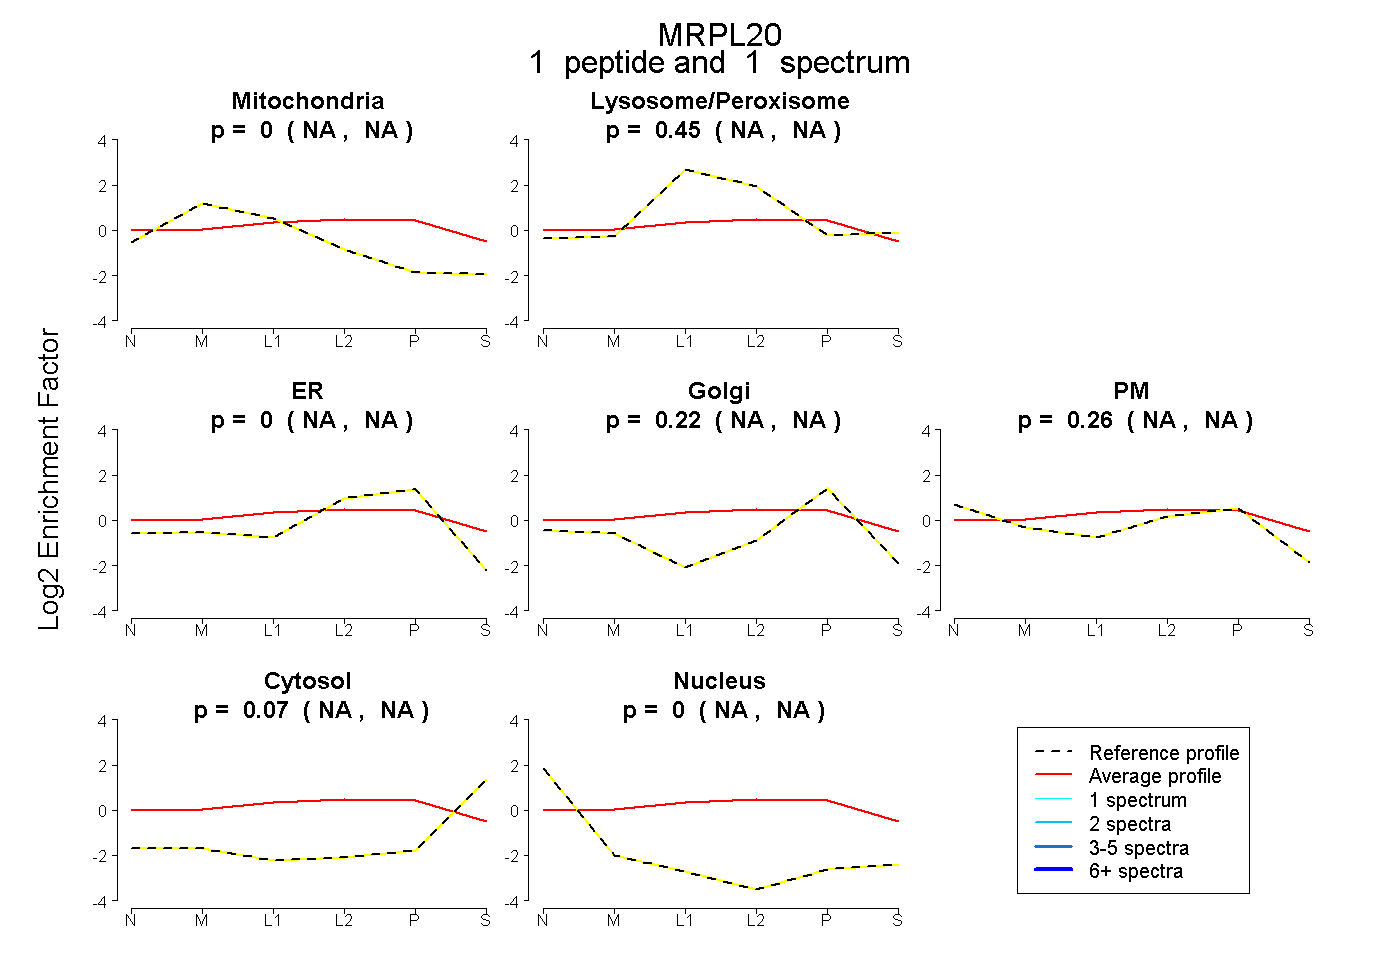
NA | NA
NA | NA
NA | NA
NA | NA
NA | NA
NA | NA
NA | NA
4peptides
spectra
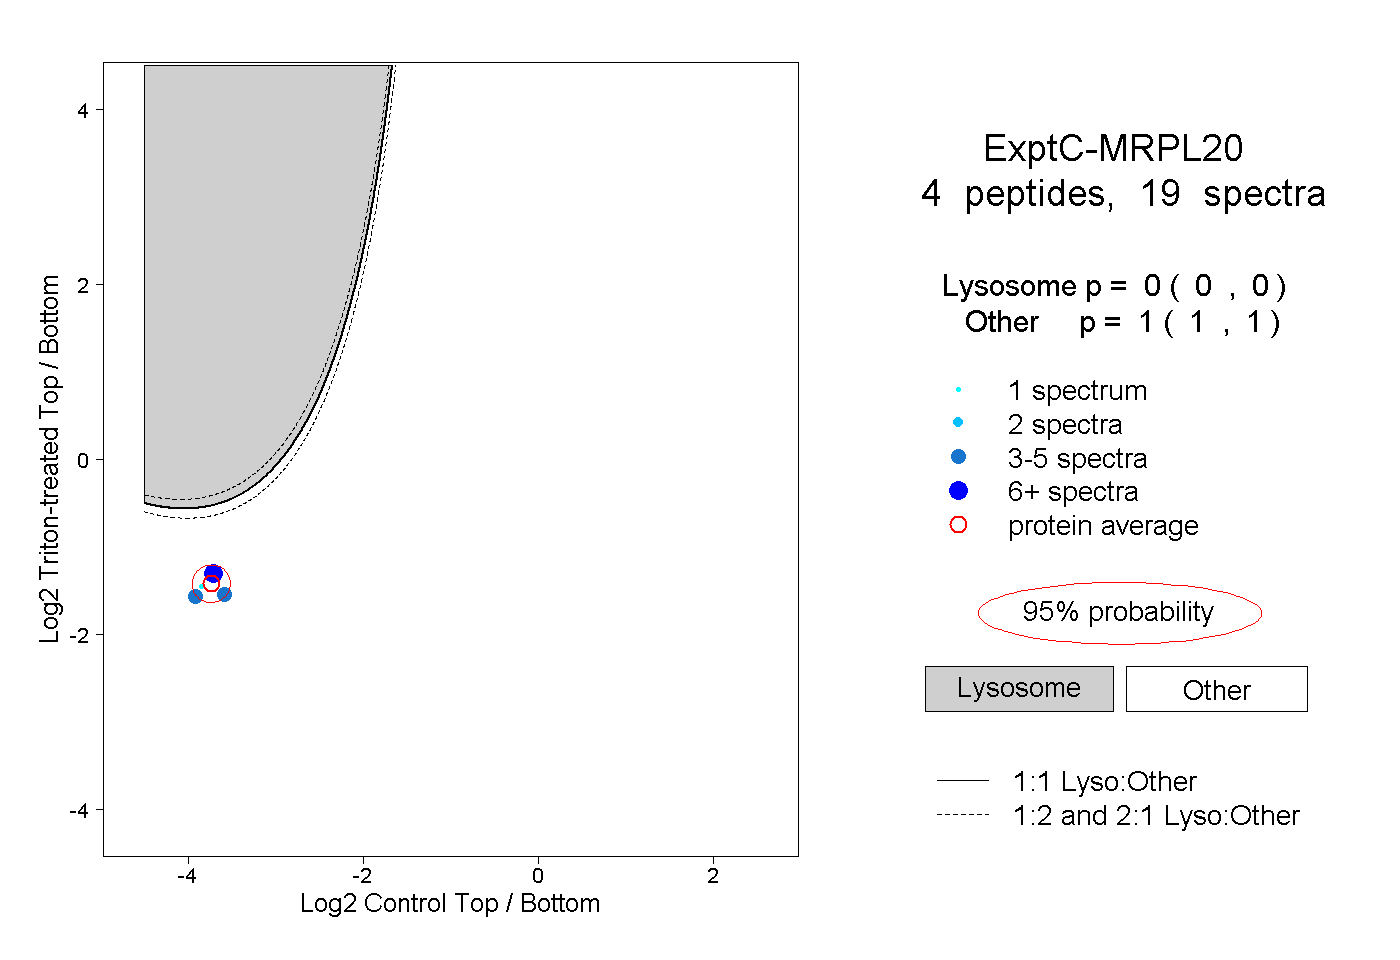
0.000 | 0.000
1.000 | 1.000