18
18peptides
spectra
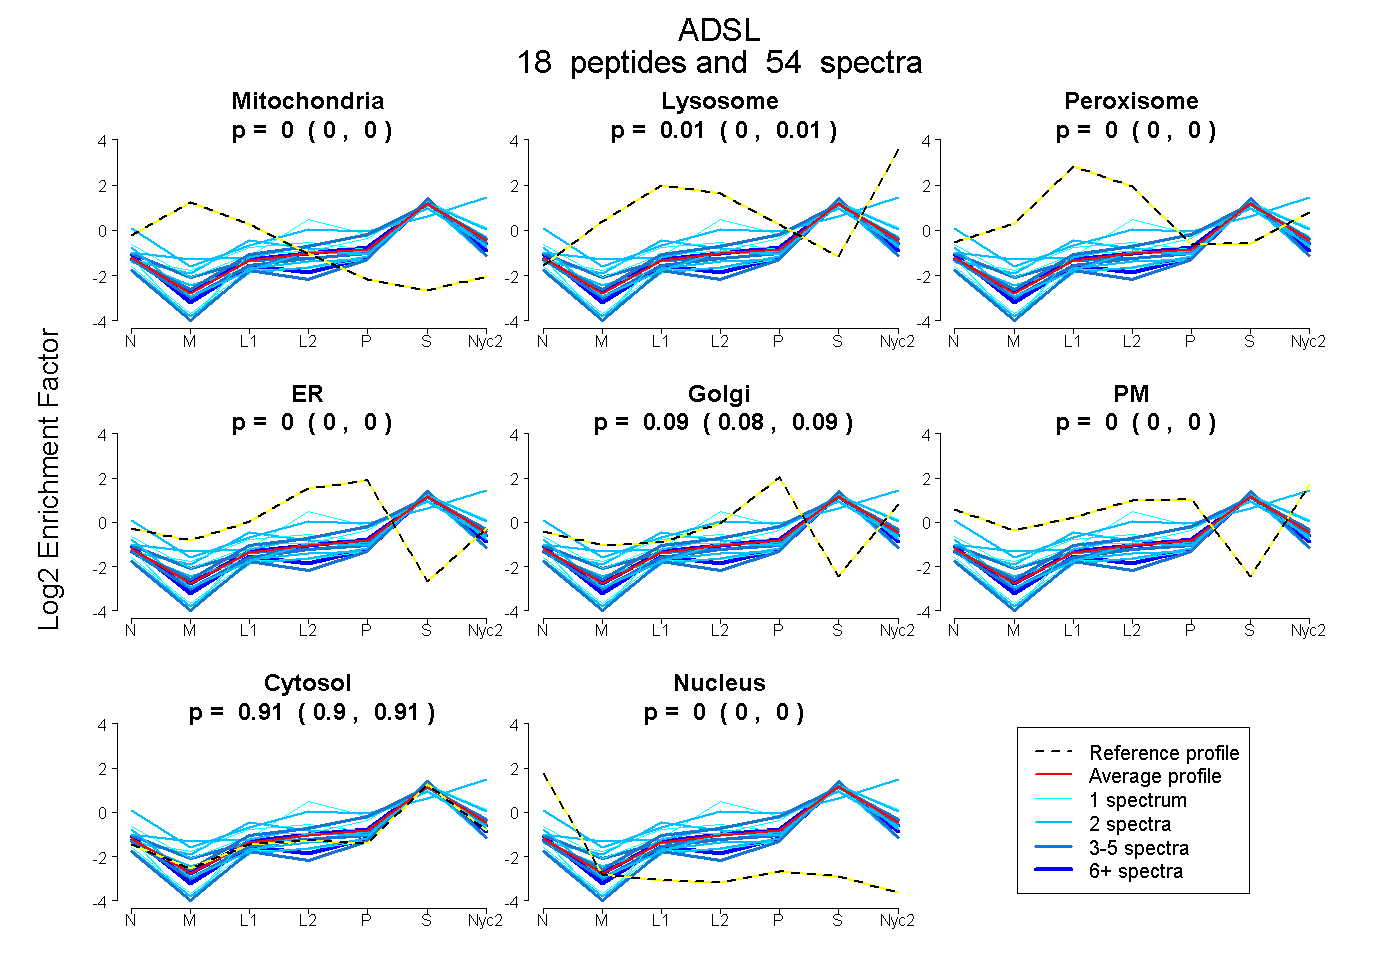
0.000 | 0.000
0.000 | 0.012
0.000 | 0.000
0.000 | 0.000
0.078 | 0.090
0.000 | 0.003
0.903 | 0.911
0.000 | 0.000
6peptides
spectra
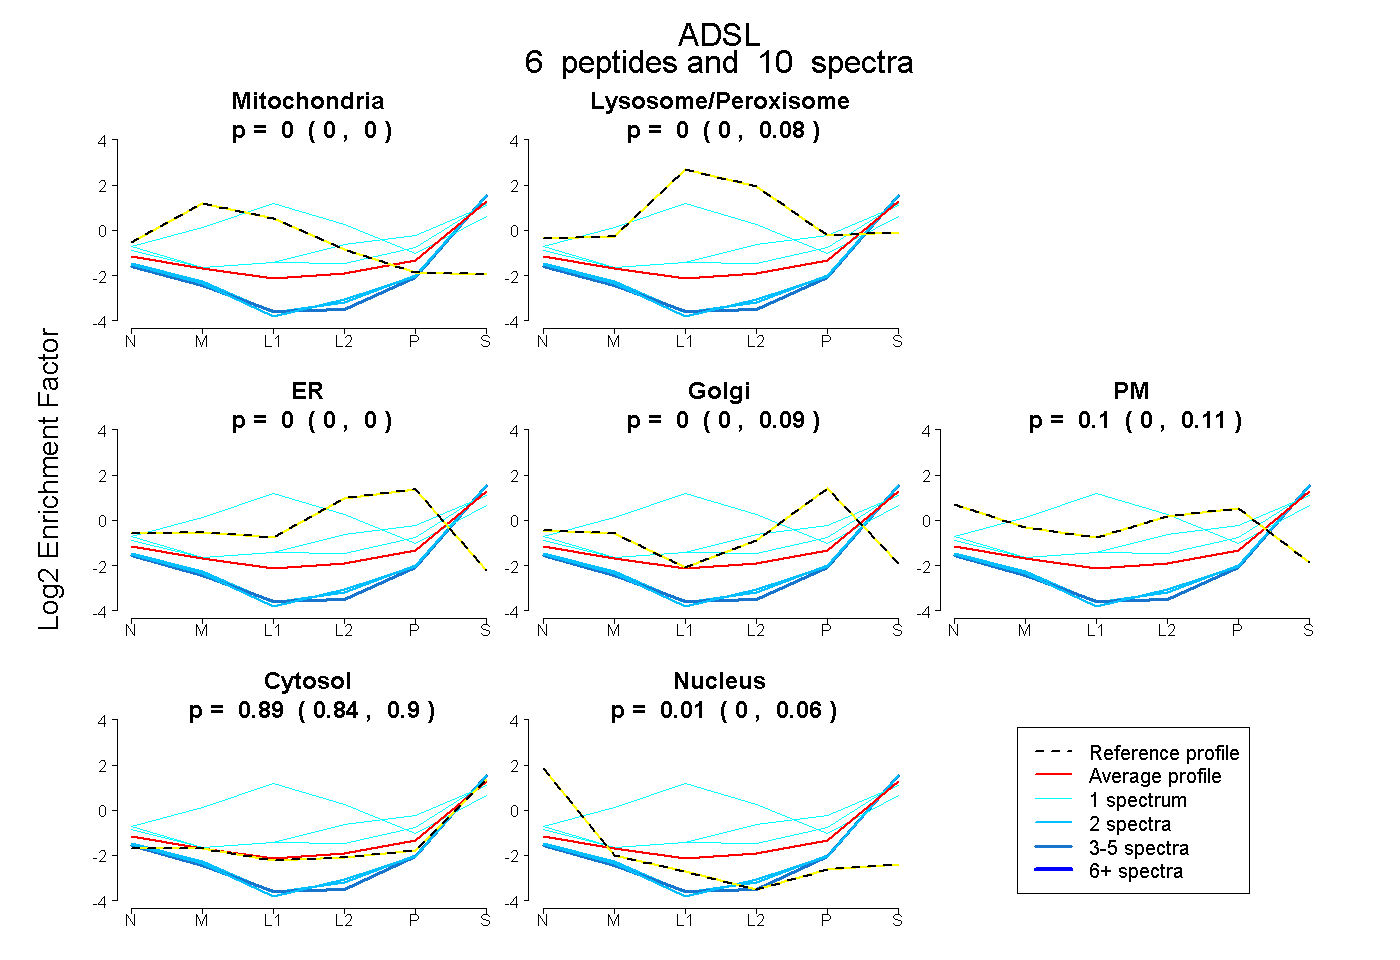
0.000 | 0.000
0.000 | 0.080
0.000 | 0.000
0.000 | 0.090
0.000 | 0.113
0.835 | 0.905
0.000 | 0.064