 2
2peptides
spectra
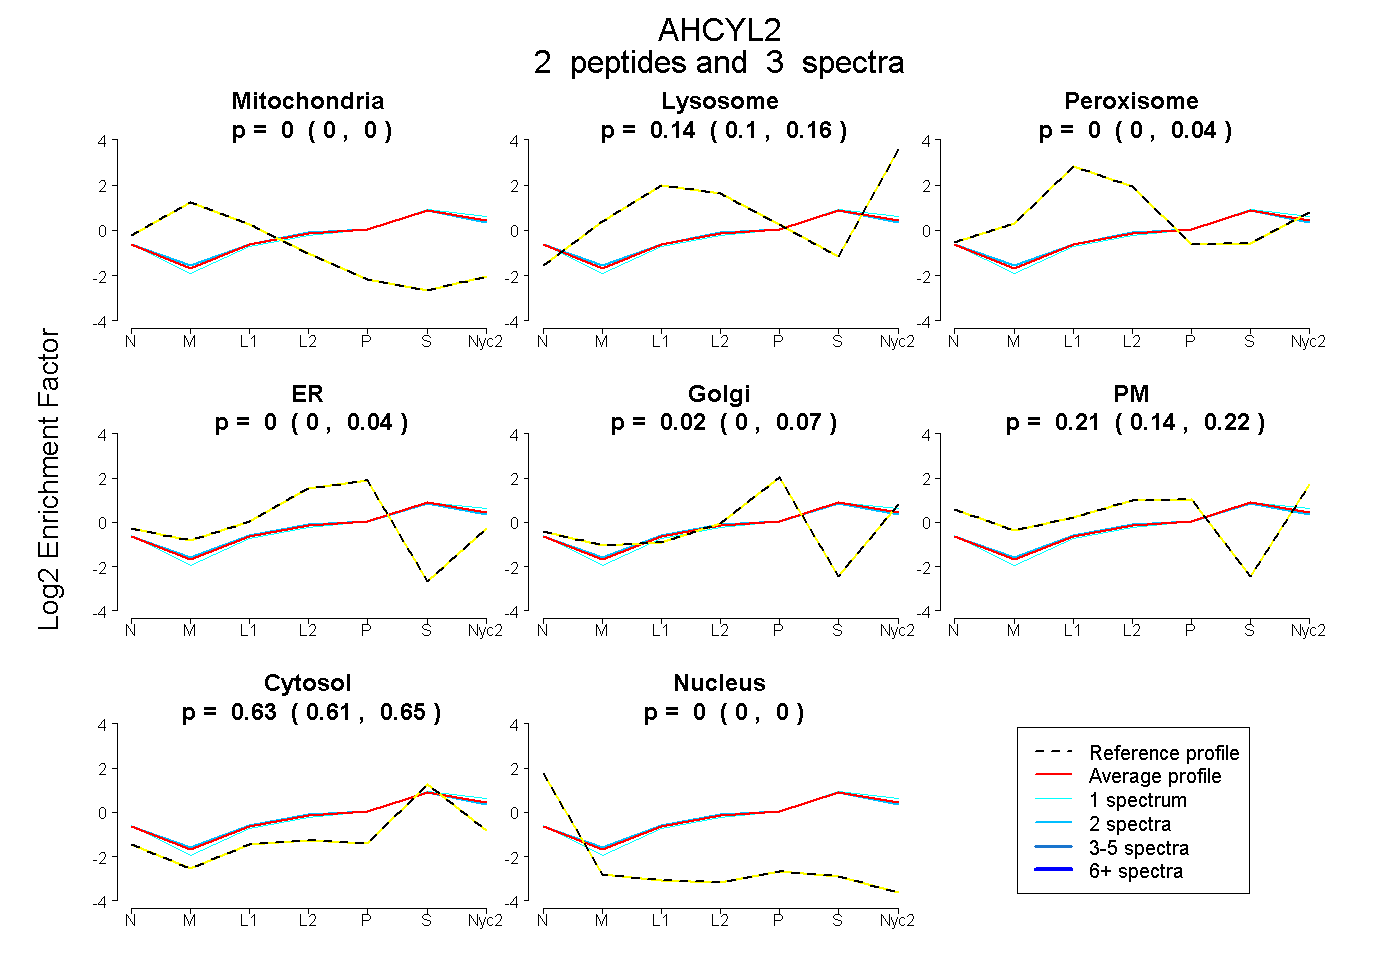
0.000 | 0.000
0.102 | 0.161
0.000 | 0.042
0.000 | 0.037
0.000 | 0.071
0.140 | 0.217
0.611 | 0.647
0.000 | 0.000
3peptides
spectra
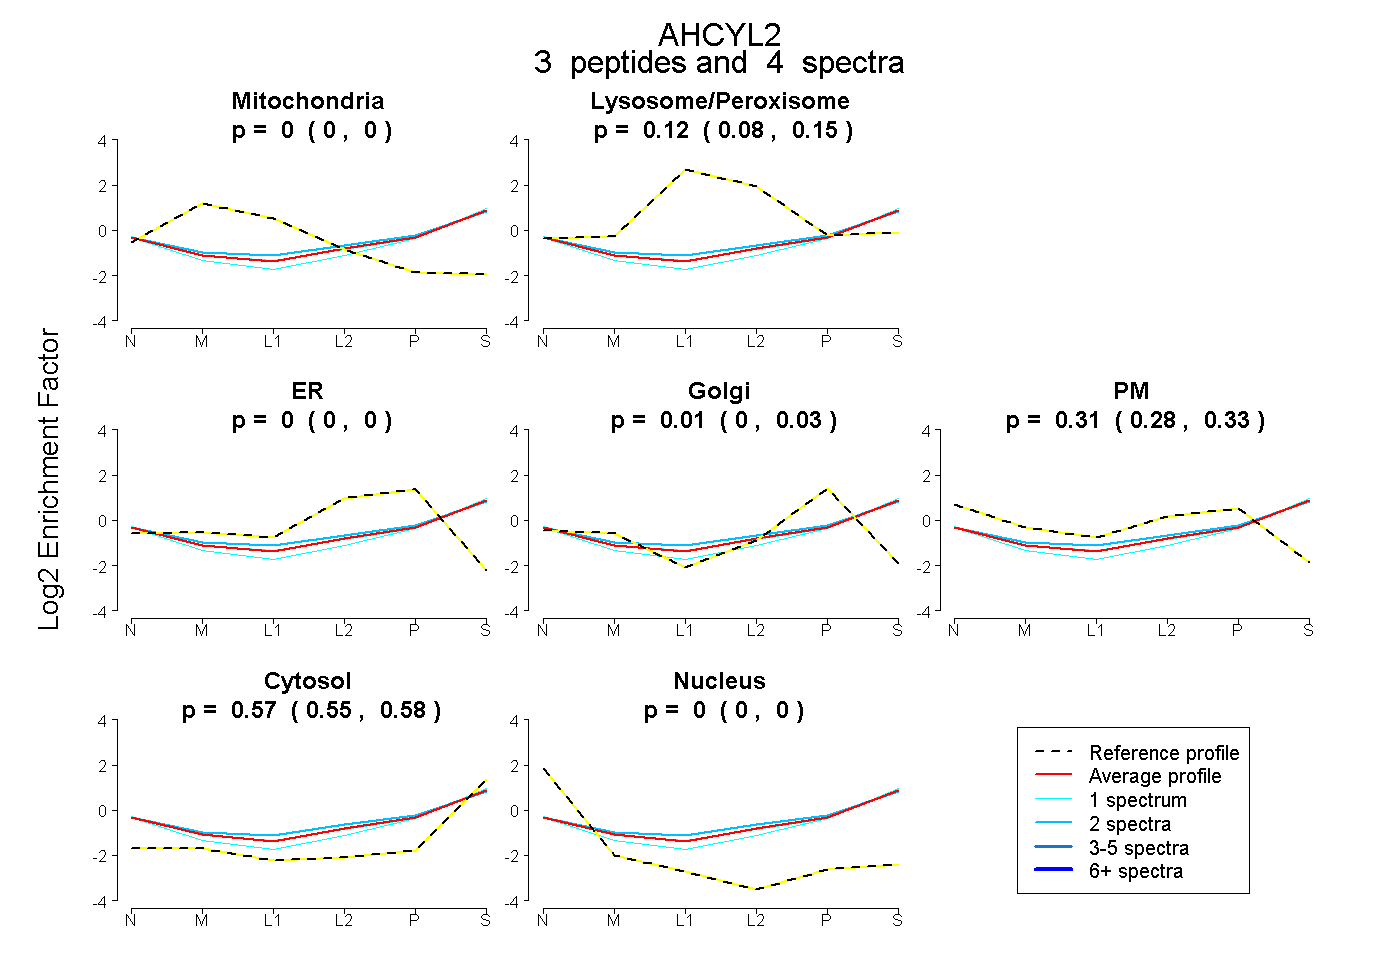
0.000 | 0.000
0.083 | 0.146
0.000 | 0.000
0.000 | 0.029
0.275 | 0.332
0.549 | 0.579
0.000 | 0.000
3peptides
spectra
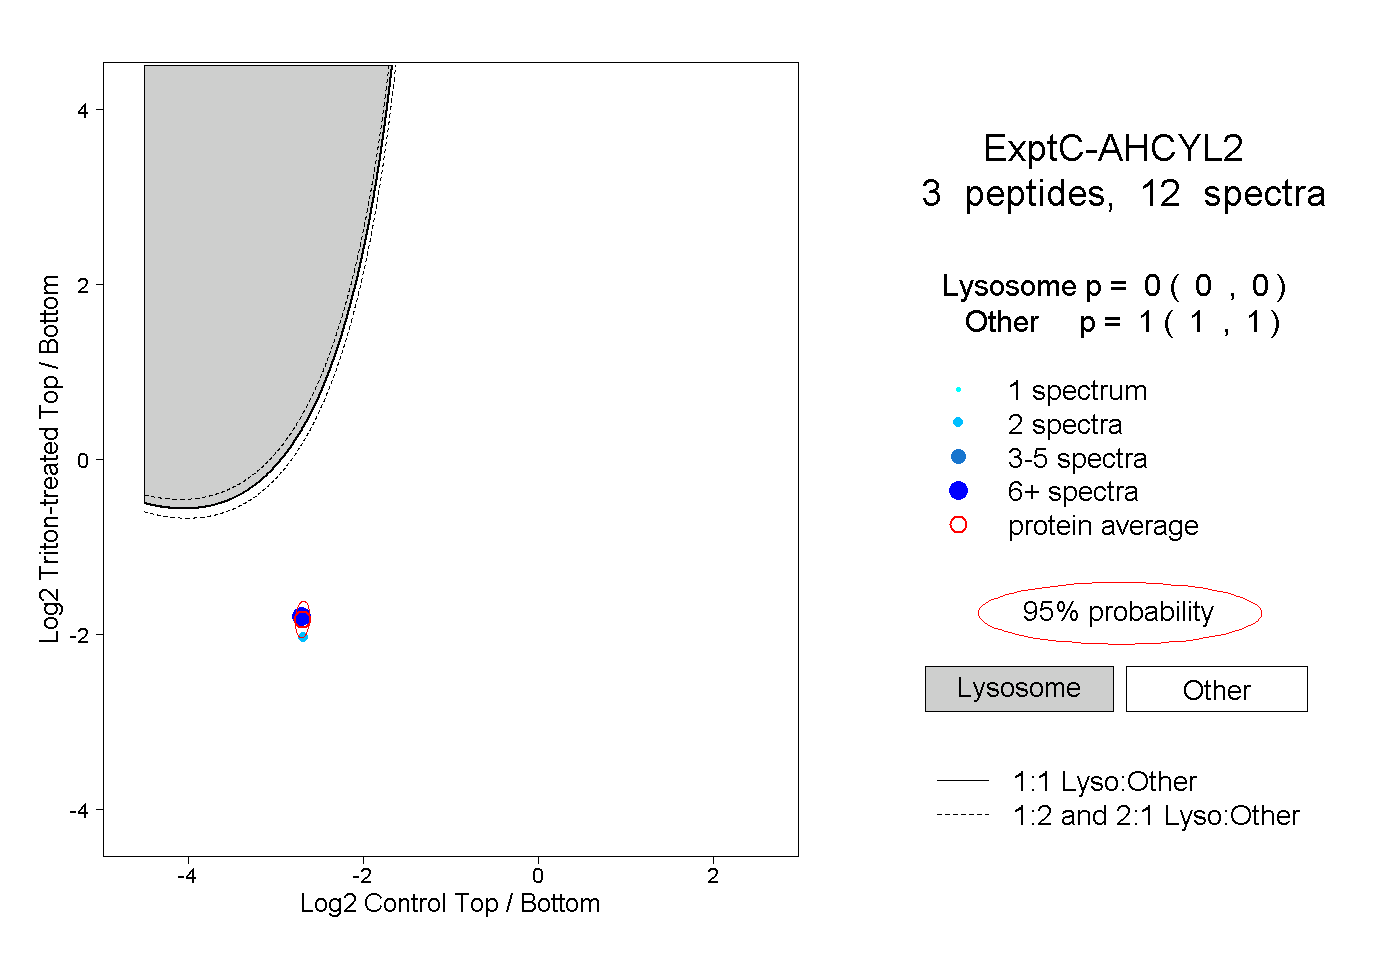
0.000 | 0.000
1.000 | 1.000