GPR155
[ENSRNOP00000025158]
Main page
| | | Plot |
Mito |
Lyso |
|
Perox |
ER |
Golgi |
PM |
Cytosol |
Nucleus |
|
| Expt A |
 10
10
peptides |
17
spectra |
 |
0.000
0.000 | 0.000 |
1.000
0.984 | 1.000 |
|
0.000
0.000 | 0.000 |
0.000
0.000 | 0.010 |
0.000
0.000 | 0.000 |
0.000
0.000 | 0.000 |
0.000
0.000 | 0.000 |
0.000
0.000 | 0.000 |
|
| | | Plot |
Mito |
|
Lyso or Perox |
|
ER |
Golgi |
PM |
Cytosol |
Nucleus |
|
| Expt B |
2
peptides |
2
spectra |
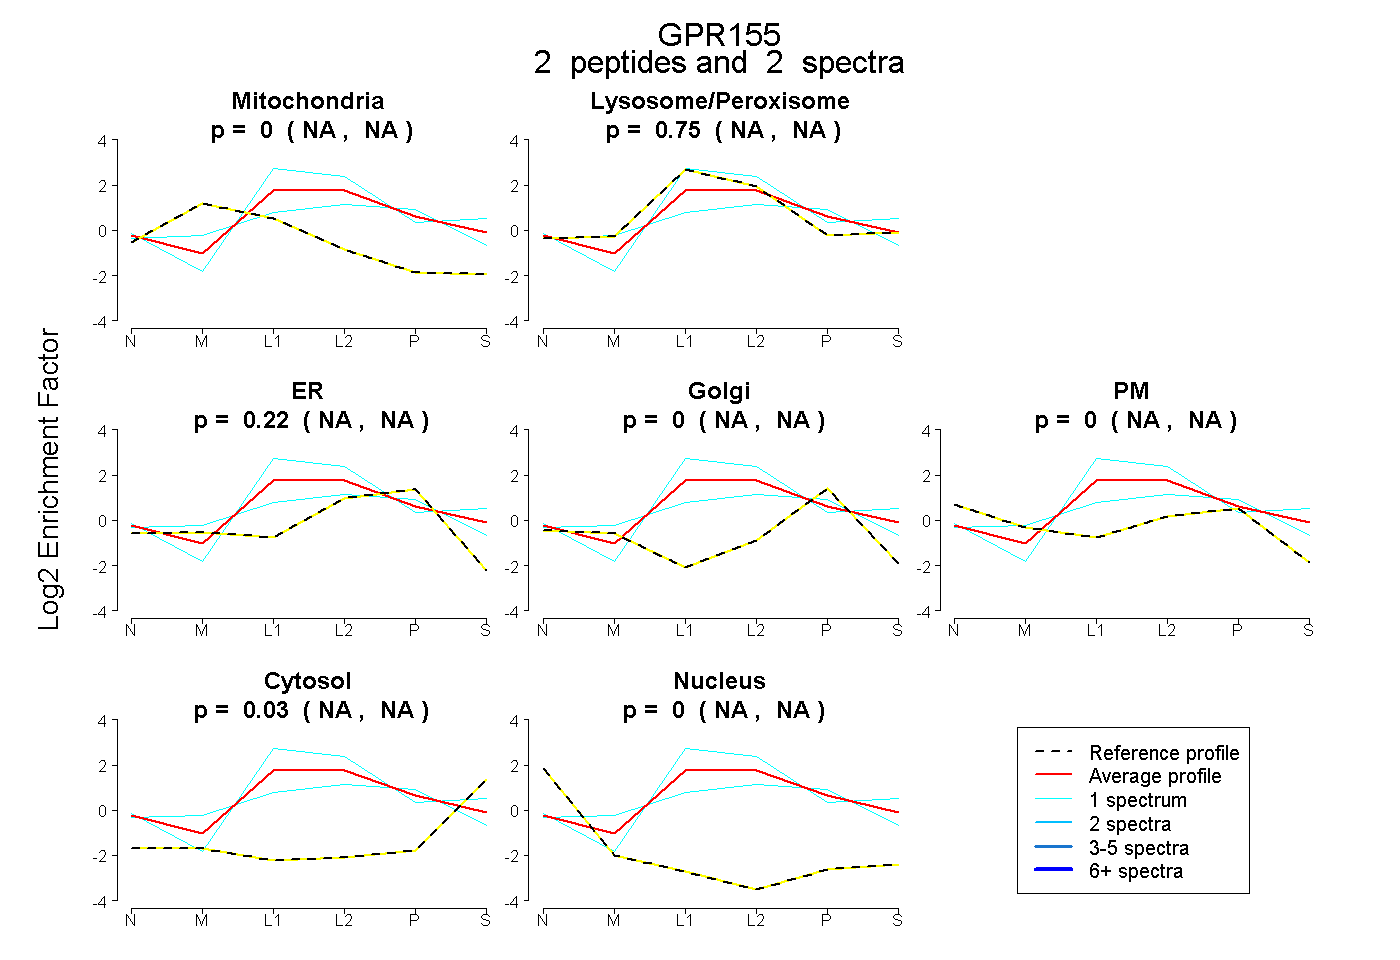 |
0.000
NA | NA |
|
0.748
NA | NA |
|
0.222
NA | NA |
0.000
NA | NA |
0.000
NA | NA |
0.030
NA | NA |
0.000
NA | NA |
|
| | | Plot |
|
Lyso |
|
|
|
|
|
|
|
Other |
| Expt C |
11
peptides |
61
spectra |
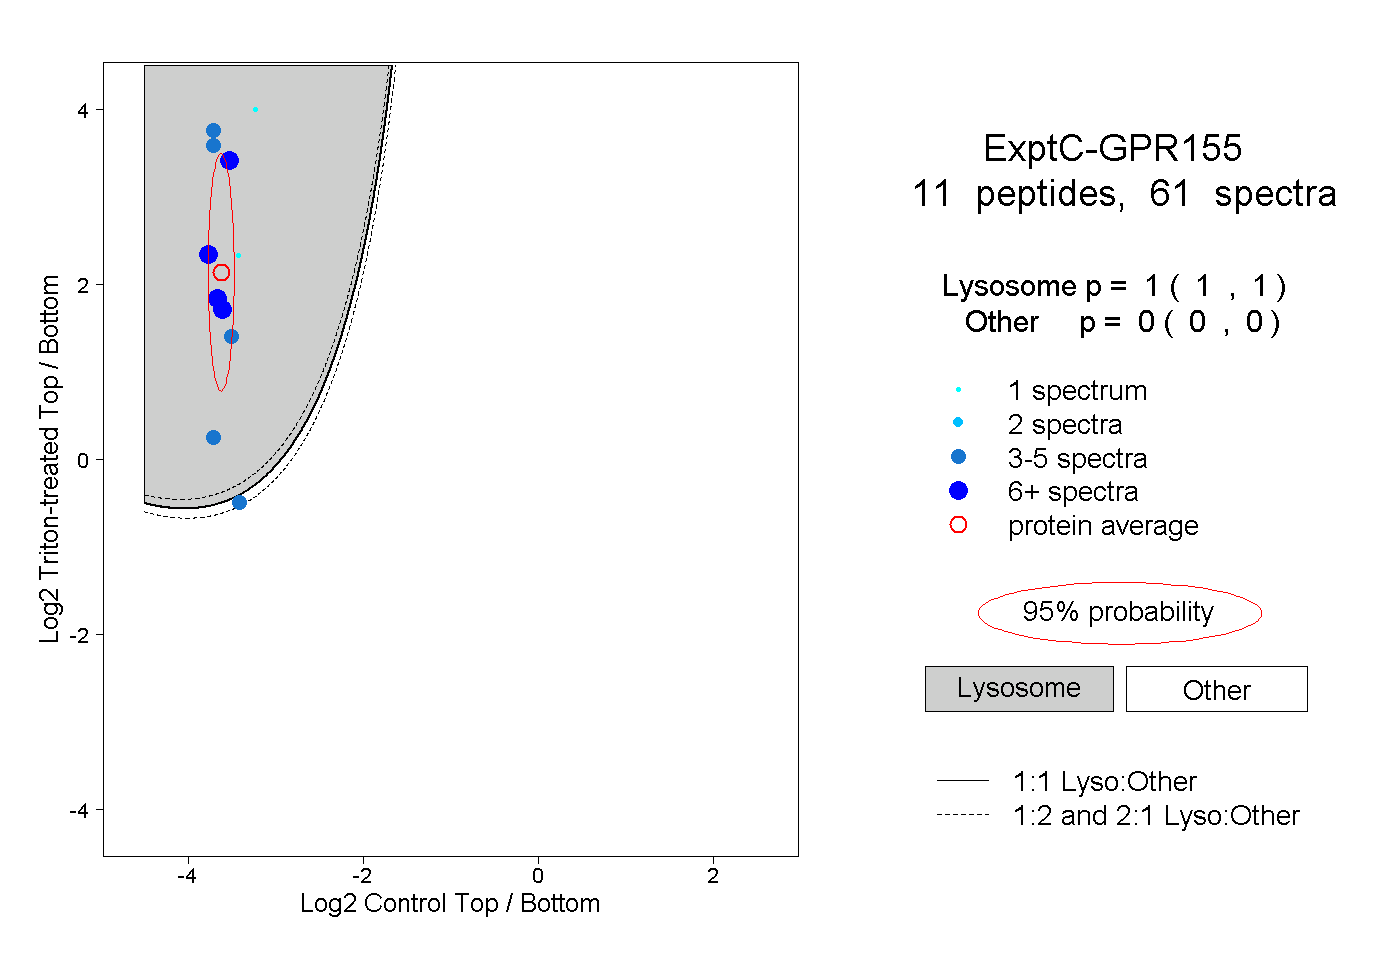 |
|
1.000
1.000 | 1.000 |
|
|
|
|
|
|
|
0.000
0.000 | 0.000 |
| 6 spectra, IVGLGFLR |
|
1.000 |
|
|
|
|
|
|
|
0.000 |
| 3 spectra, GLGNFVSR |
|
1.000 |
|
|
|
|
|
|
|
0.000 |
| 13 spectra, EMVEVLDK |
|
1.000 |
|
|
|
|
|
|
|
0.000 |
| 1 spectrum, LLVLPLLCR |
|
1.000 |
|
|
|
|
|
|
|
0.000 |
| 11 spectra, GEAVIYGDR |
|
1.000 |
|
|
|
|
|
|
|
0.000 |
| 1 spectrum, DEYLFYR |
|
1.000 |
|
|
|
|
|
|
|
0.000 |
| 5 spectra, FALPALLFK |
|
1.000 |
|
|
|
|
|
|
|
0.000 |
| 5 spectra, NASQNK |
|
1.000 |
|
|
|
|
|
|
|
0.000 |
| 4 spectra, ANVITSTQAK |
|
1.000 |
|
|
|
|
|
|
|
0.000 |
| 8 spectra, ESPVSEEIK |
|
1.000 |
|
|
|
|
|
|
|
0.000 |
| 4 spectra, HLIILPFK |
|
0.282 |
|
|
|
|
|
|
|
0.718 |
| | | Plot |
|
Lyso |
|
|
|
|
|
|
|
Other |
| Expt D |
2
peptides |
2
spectra |
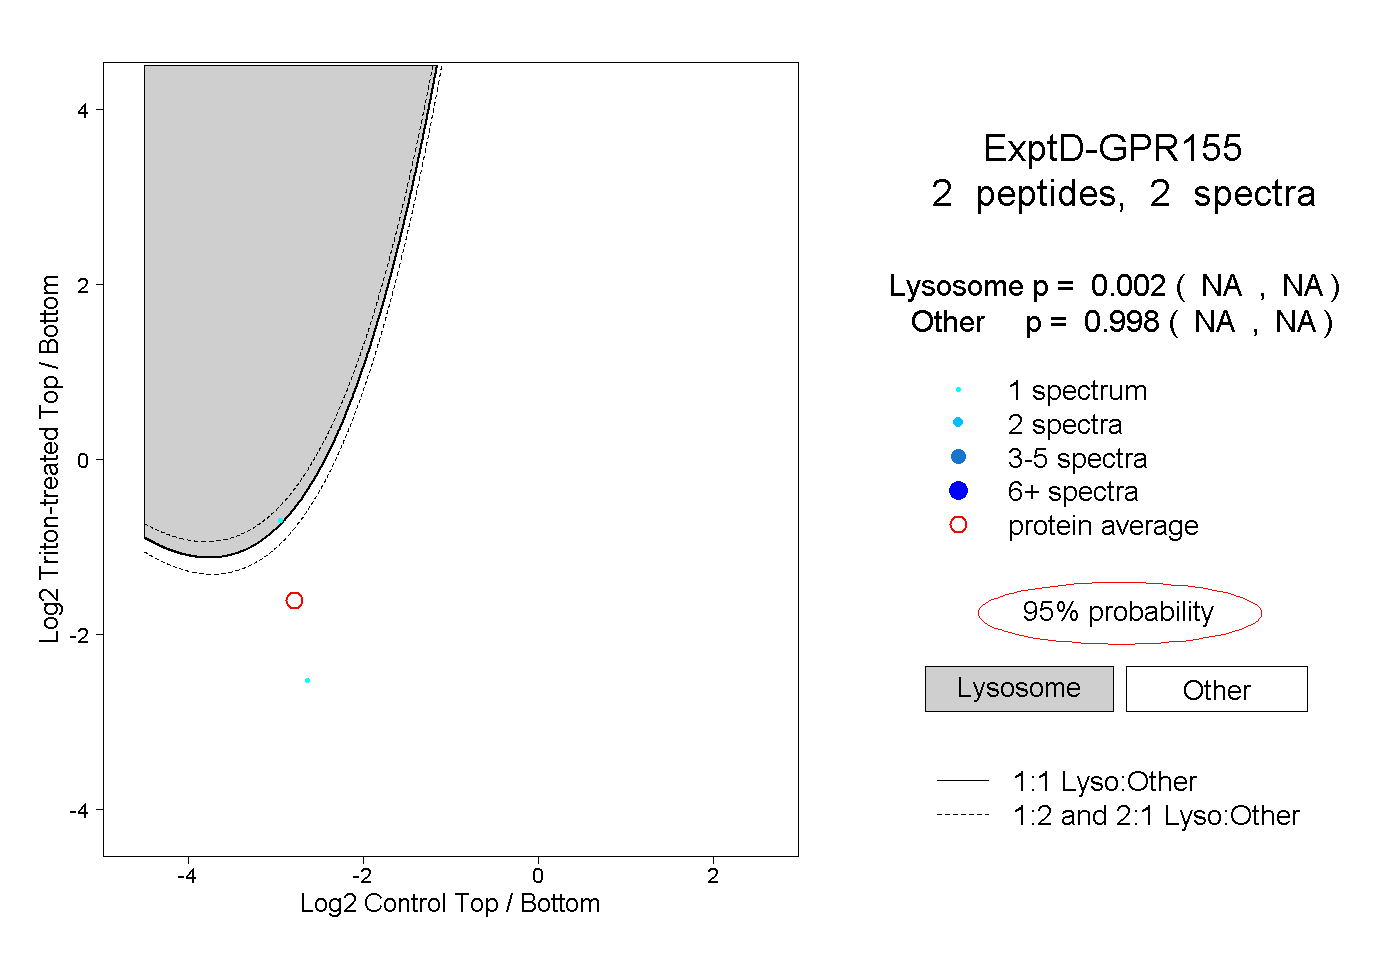 |
|
0.002
NA | NA |
|
|
|
|
|
|
|
0.998
NA | NA |