 10
10peptides
spectra

0.000 | 0.000
0.984 | 1.000
0.000 | 0.000
0.000 | 0.010
0.000 | 0.000
0.000 | 0.000
0.000 | 0.000
0.000 | 0.000
2peptides
spectra
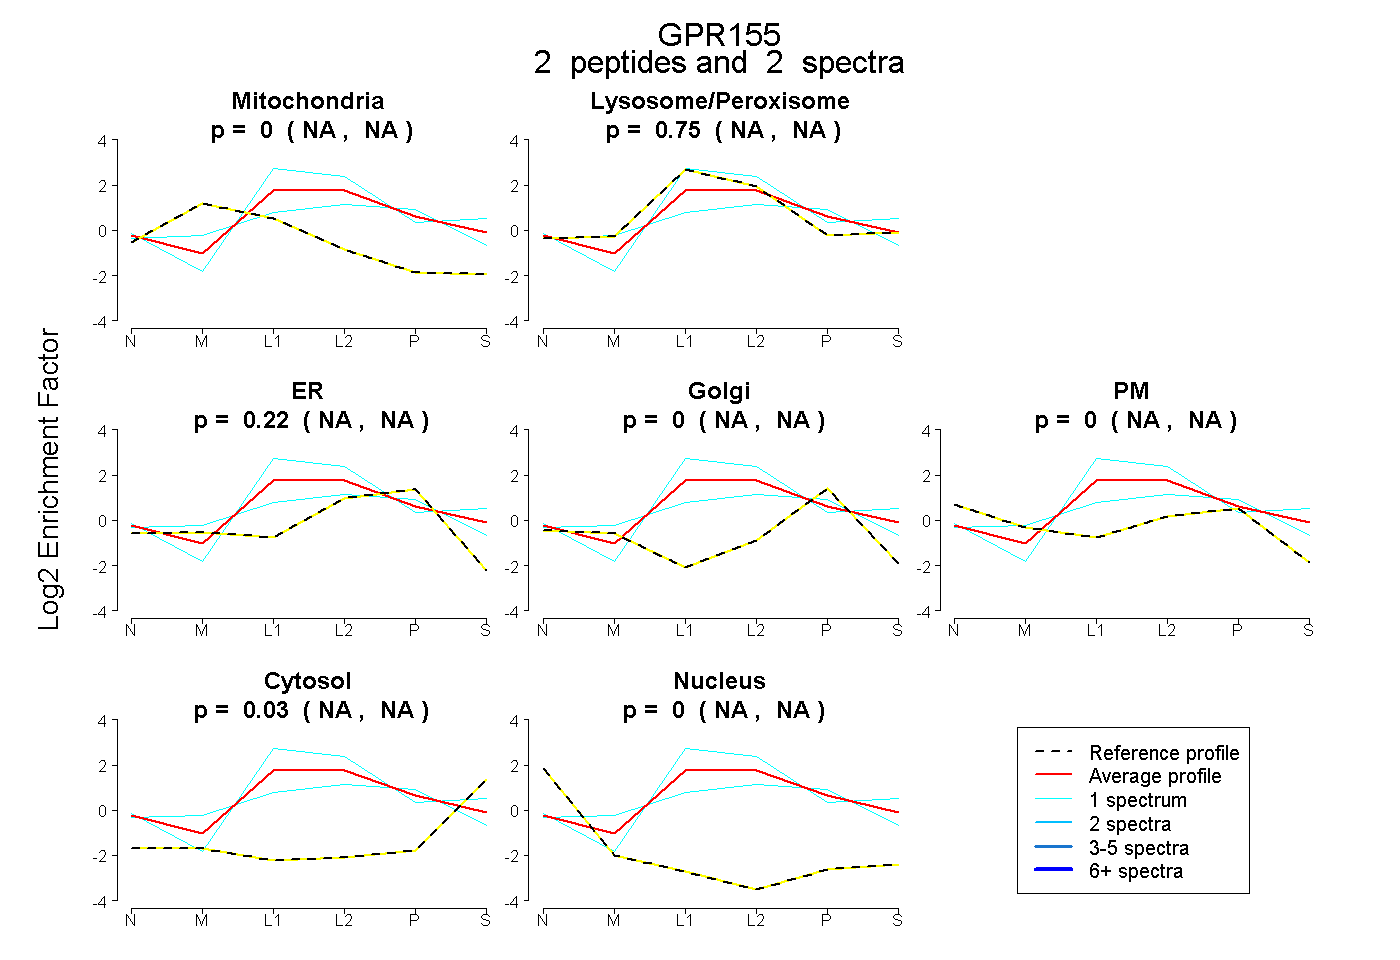
NA | NA
NA | NA
NA | NA
NA | NA
NA | NA
NA | NA
NA | NA
| Plot | Mito | Lyso | Perox | ER | Golgi | PM | Cytosol | Nucleus | |||||
| Expt A |
10 peptides |
17 spectra |
|
0.000 0.000 | 0.000 |
1.000 0.984 | 1.000 |
0.000 0.000 | 0.000 |
0.000 0.000 | 0.010 |
0.000 0.000 | 0.000 |
0.000 0.000 | 0.000 |
0.000 0.000 | 0.000 |
0.000 0.000 | 0.000 |
||
| Plot | Mito | Lyso or Perox | ER | Golgi | PM | Cytosol | Nucleus | ||||||
| Expt B |
2 peptides |
2 spectra |
|
0.000 NA | NA |
0.748 NA | NA |
0.222 NA | NA |
0.000 NA | NA |
0.000 NA | NA |
0.030 NA | NA |
0.000 NA | NA |
| 1 spectrum, GLGNFVSR | 0.000 | 0.999 | 0.000 | 0.000 | 0.000 | 0.001 | 0.000 | |||
| 1 spectrum, SPPAGTVSNPPEESYK | 0.000 | 0.549 | 0.211 | 0.241 | 0.000 | 0.000 | 0.000 |
| Plot | Lyso | Other | |||||||||||
| Expt C |
11 peptides |
61 spectra |
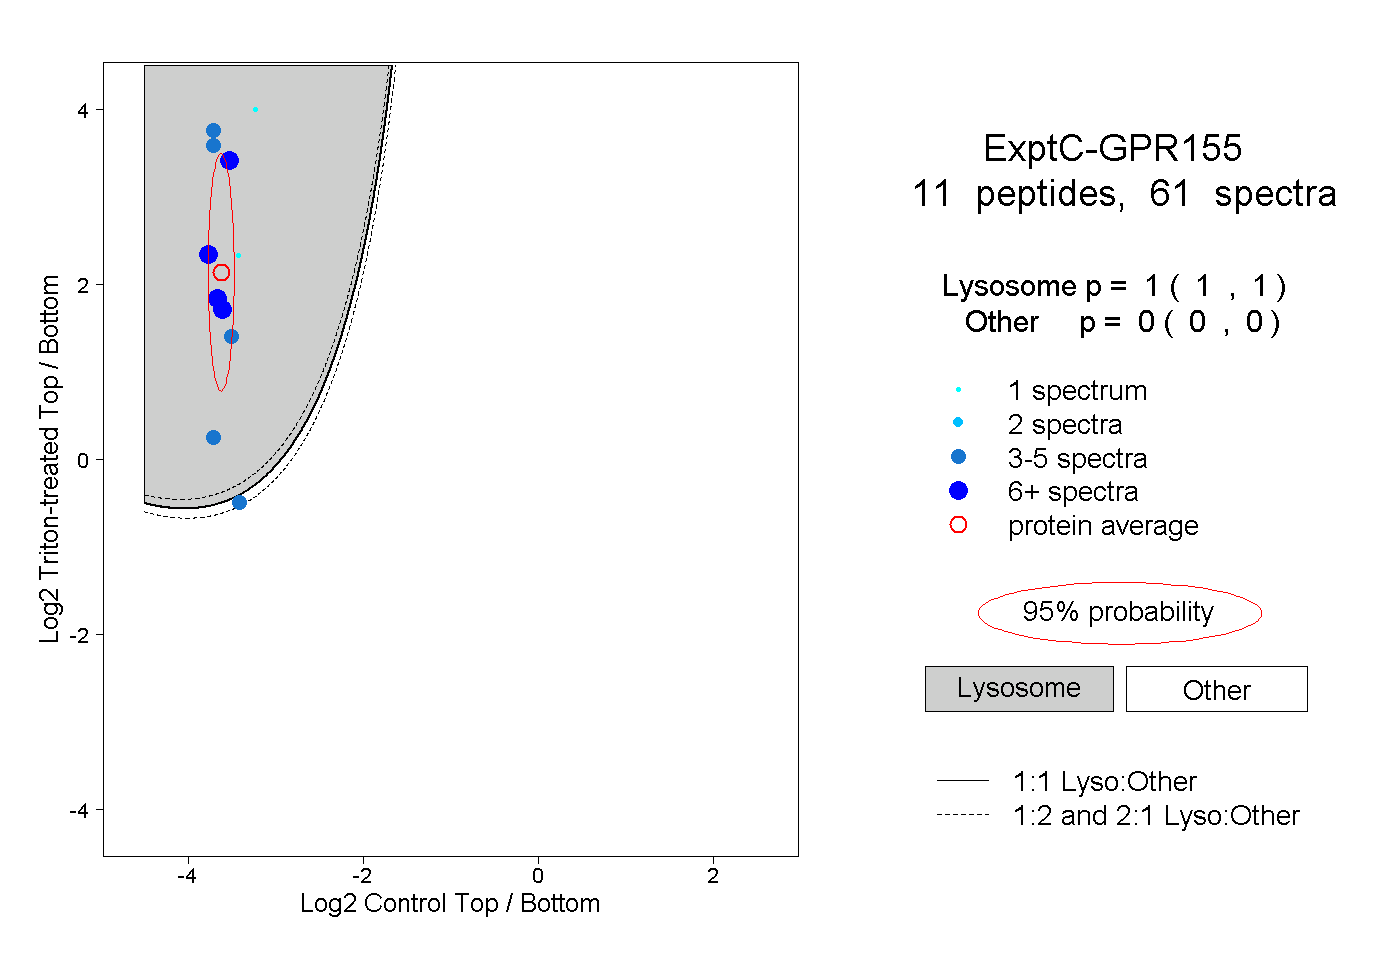 |
1.000 1.000 | 1.000 |
0.000 0.000 | 0.000 |
||||||||
| Plot | Lyso | Other | |||||||||||
| Expt D |
2 peptides |
2 spectra |
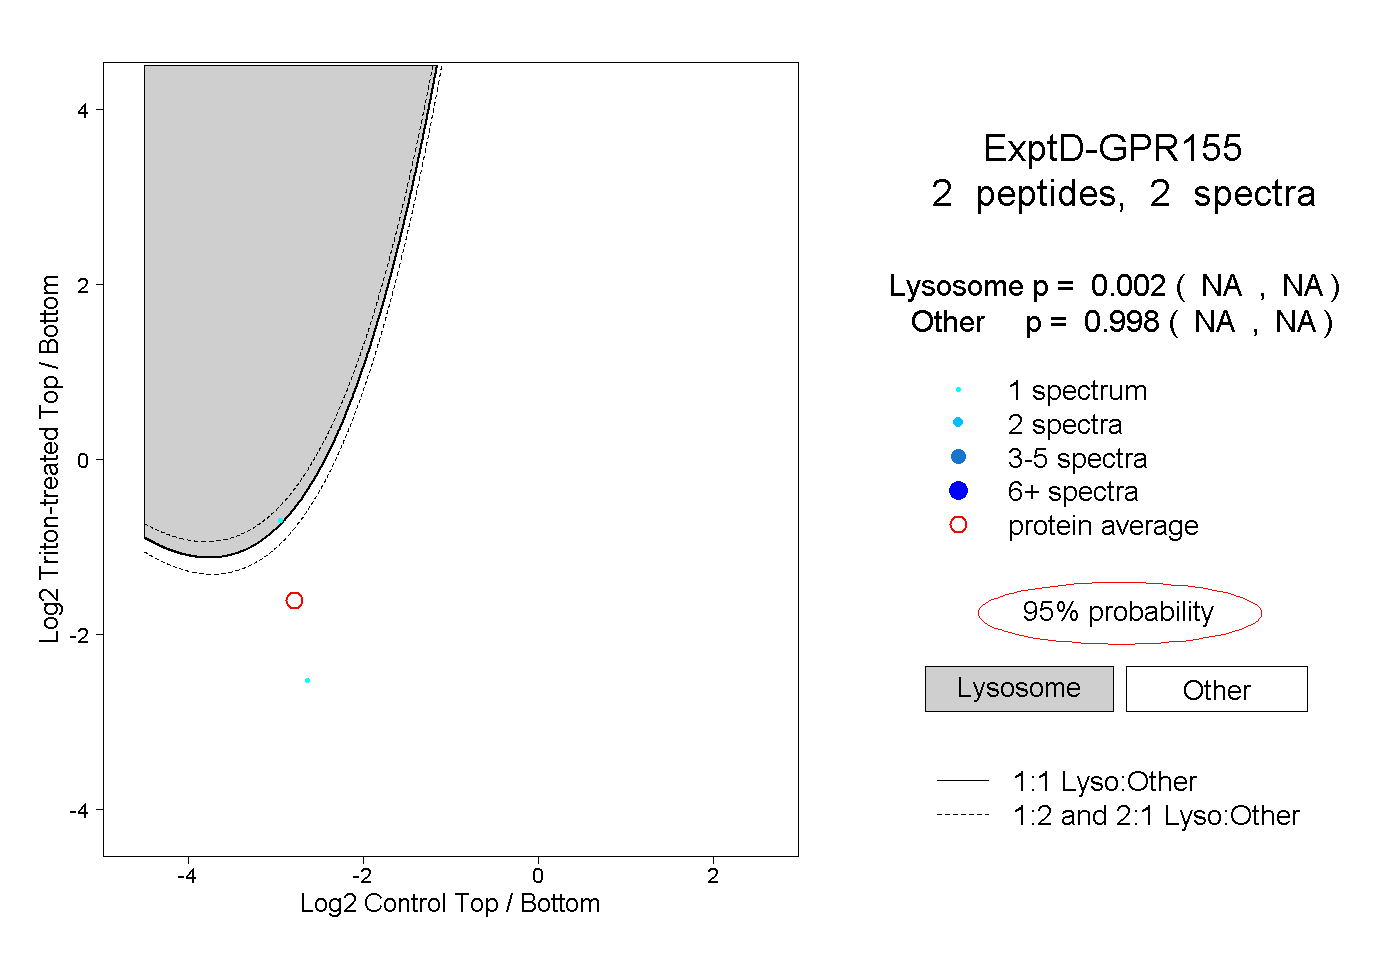 |
0.002 NA | NA |
0.998 NA | NA |