 1
1peptide
spectra
0.000 | 0.000
0.000 | 0.680
0.075 | 0.674
0.000 | 0.199
0.000 | 0.000
0.000 | 0.000
0.102 | 0.215
0.000 | 0.000
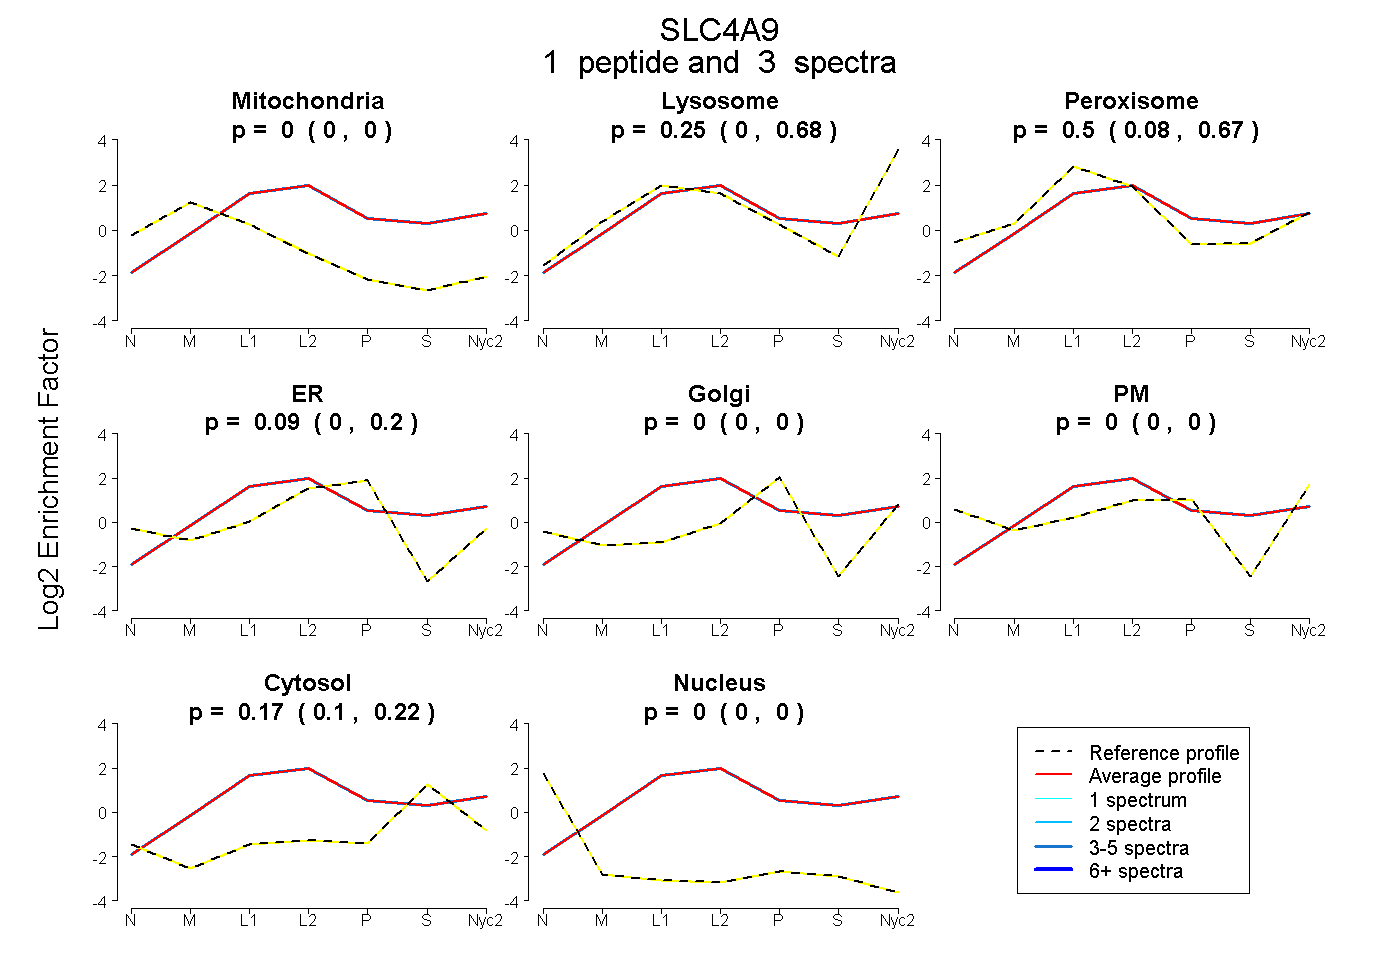
| Plot | Mito | Lyso | Perox | ER | Golgi | PM | Cytosol | Nucleus | |||||
| Expt A |
1 peptide |
3 spectra |
|
0.000 0.000 | 0.000 |
0.245 0.000 | 0.680 |
0.496 0.075 | 0.674 |
0.093 0.000 | 0.199 |
0.000 0.000 | 0.000 |
0.000 0.000 | 0.000 |
0.165 0.102 | 0.215 |
0.000 0.000 | 0.000 |