RAB6A
[ENSRNOP00000025104]
Main page
| | | Plot |
Mito |
Lyso |
|
Perox |
ER |
Golgi |
PM |
Cytosol |
Nucleus |
|
| Expt A |
 11
11
peptides |
30
spectra |
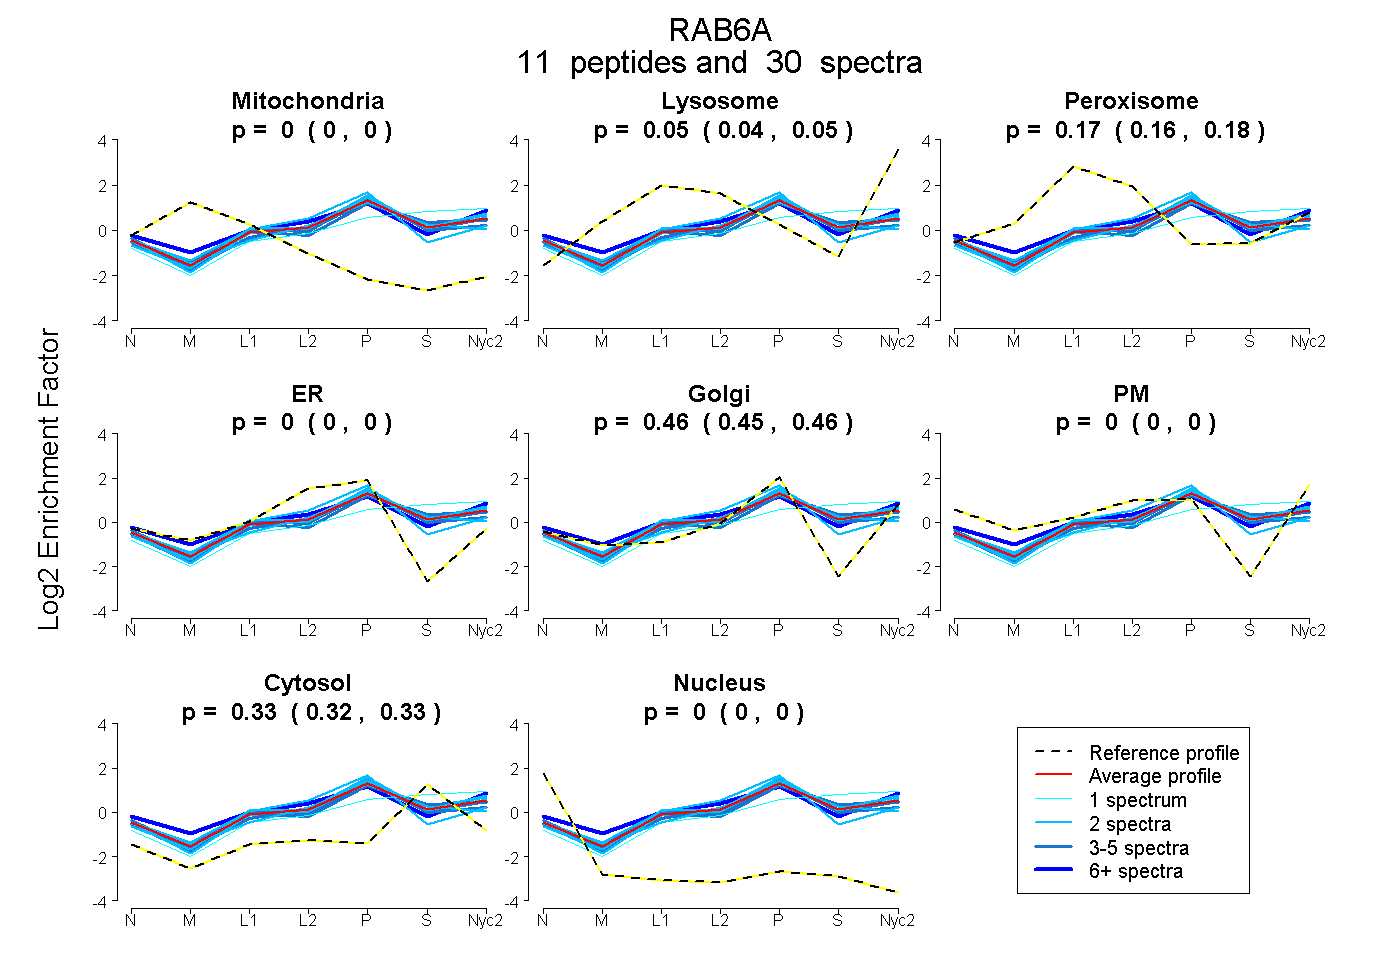 |
0.000
0.000 | 0.000 |
0.046
0.036 | 0.054 |
|
0.168
0.158 | 0.175 |
0.000
0.000 | 0.000 |
0.459
0.452 | 0.465 |
0.000
0.000 | 0.000 |
0.327
0.322 | 0.331 |
0.000
0.000 | 0.000 |
|
| | | Plot |
Mito |
|
Lyso or Perox |
|
ER |
Golgi |
PM |
Cytosol |
Nucleus |
|
| Expt B |
5
peptides |
16
spectra |
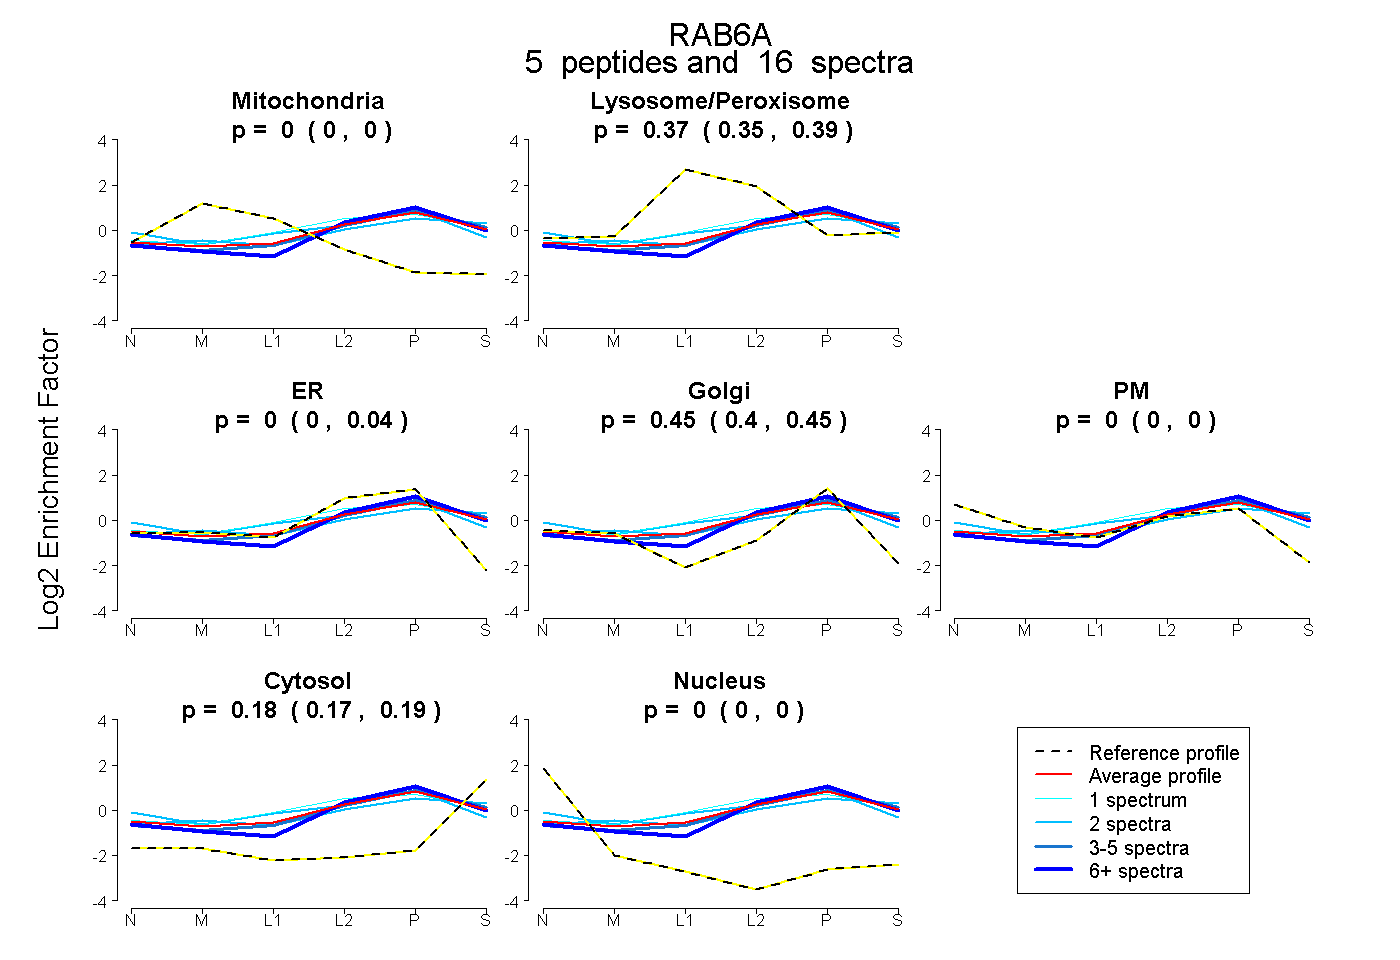 |
0.000
0.000 | 0.000 |
|
0.374
0.347 | 0.386 |
|
0.000
0.000 | 0.044 |
0.447
0.400 | 0.454 |
0.000
0.000 | 0.000 |
0.179
0.169 | 0.193 |
0.000
0.000 | 0.000 |
|
| 2 spectra, GSDVIIMLVGNK |
0.000 |
|
0.355 |
|
0.000 |
0.384 |
0.000 |
0.261 |
0.000 |
|
| 8 spectra, SLIPSYIR |
0.000 |
|
0.151 |
|
0.397 |
0.183 |
0.000 |
0.269 |
0.000 |
|
| 1 spectrum, ELNVMFIETSAK |
0.000 |
|
0.468 |
|
0.000 |
0.376 |
0.000 |
0.156 |
0.000 |
|
| 2 spectra, AGYNVK |
0.000 |
|
0.423 |
|
0.000 |
0.482 |
0.009 |
0.087 |
0.000 |
|
| 3 spectra, QVSIEEGER |
0.000 |
|
0.312 |
|
0.108 |
0.353 |
0.000 |
0.228 |
0.000 |
|
| | | Plot |
|
Lyso |
|
|
|
|
|
|
|
Other |
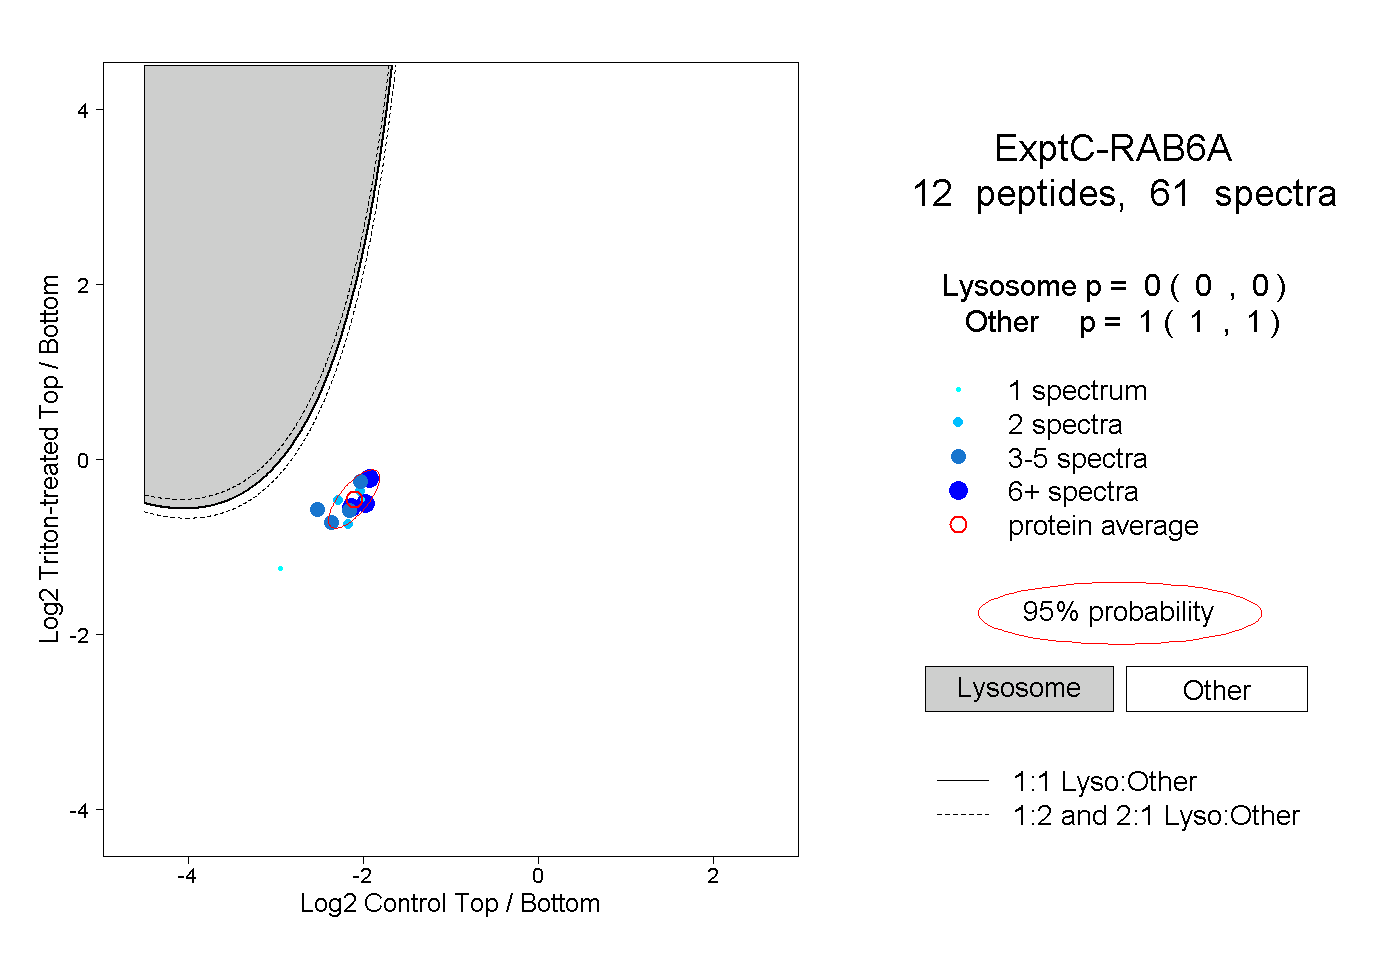
| Expt C |
12
peptides |
61
spectra |
 |
|
0.000
0.000 | 0.000 |
|
|
|
|
|
|
|
1.000
1.000 | 1.000 |
| | | Plot |
|
Lyso |
|
|
|
|
|
|
|
Other |
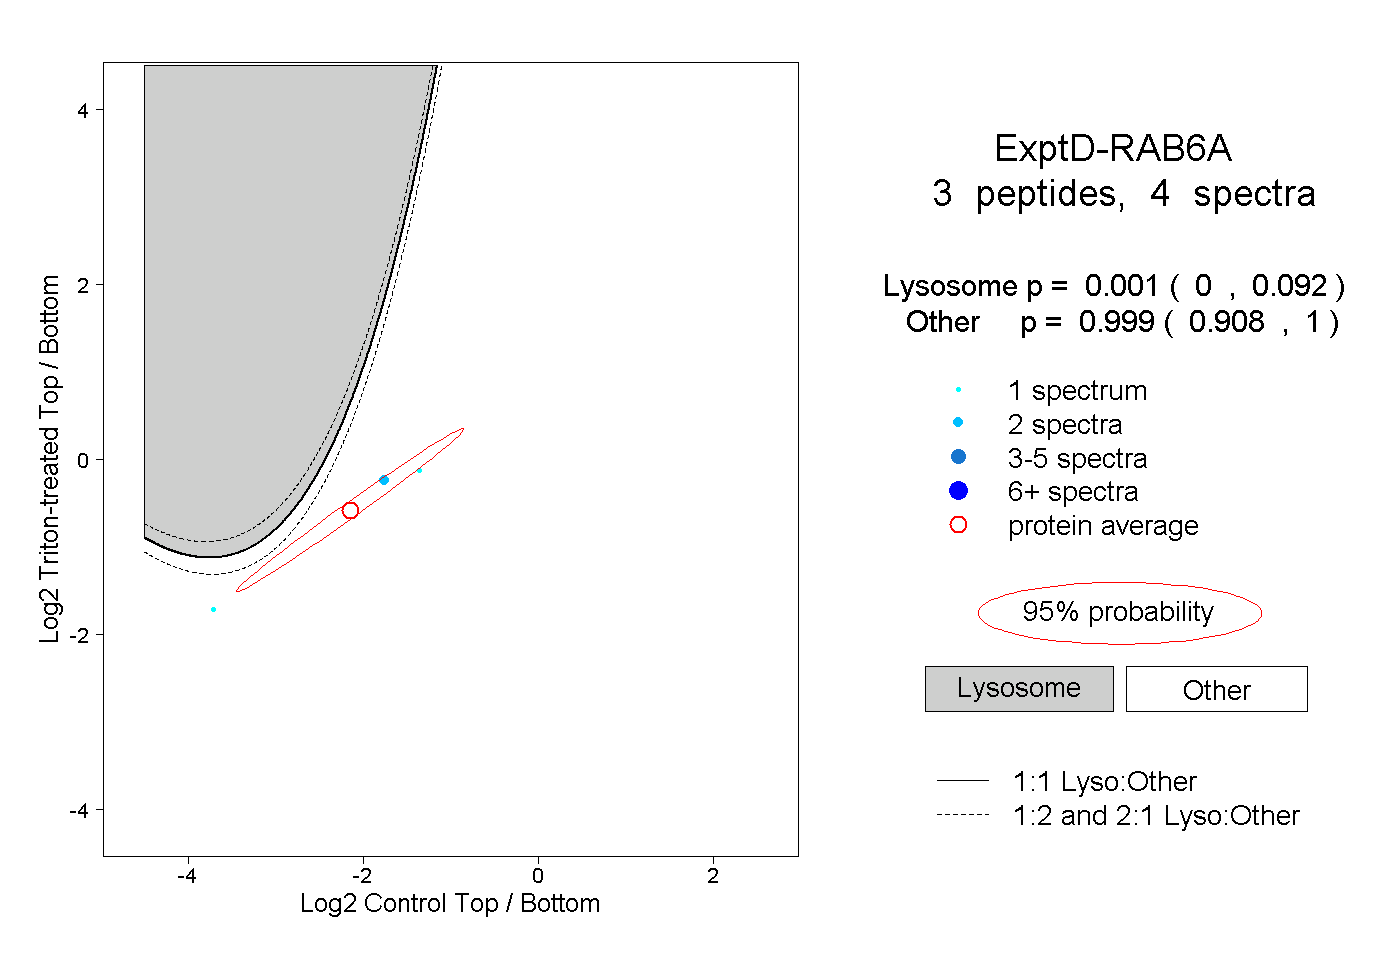
| Expt D |
3
peptides |
4
spectra |
 |
|
0.001
0.000 | 0.092 |
|
|
|
|
|
|
|
0.999
0.908 | 1.000 |