NUP93
[ENSRNOP00000025086]
Main page
| | | Plot |
Mito |
Lyso |
|
Perox |
ER |
Golgi |
PM |
Cytosol |
Nucleus |
|
| Expt A |
 18
18
peptides |
24
spectra |
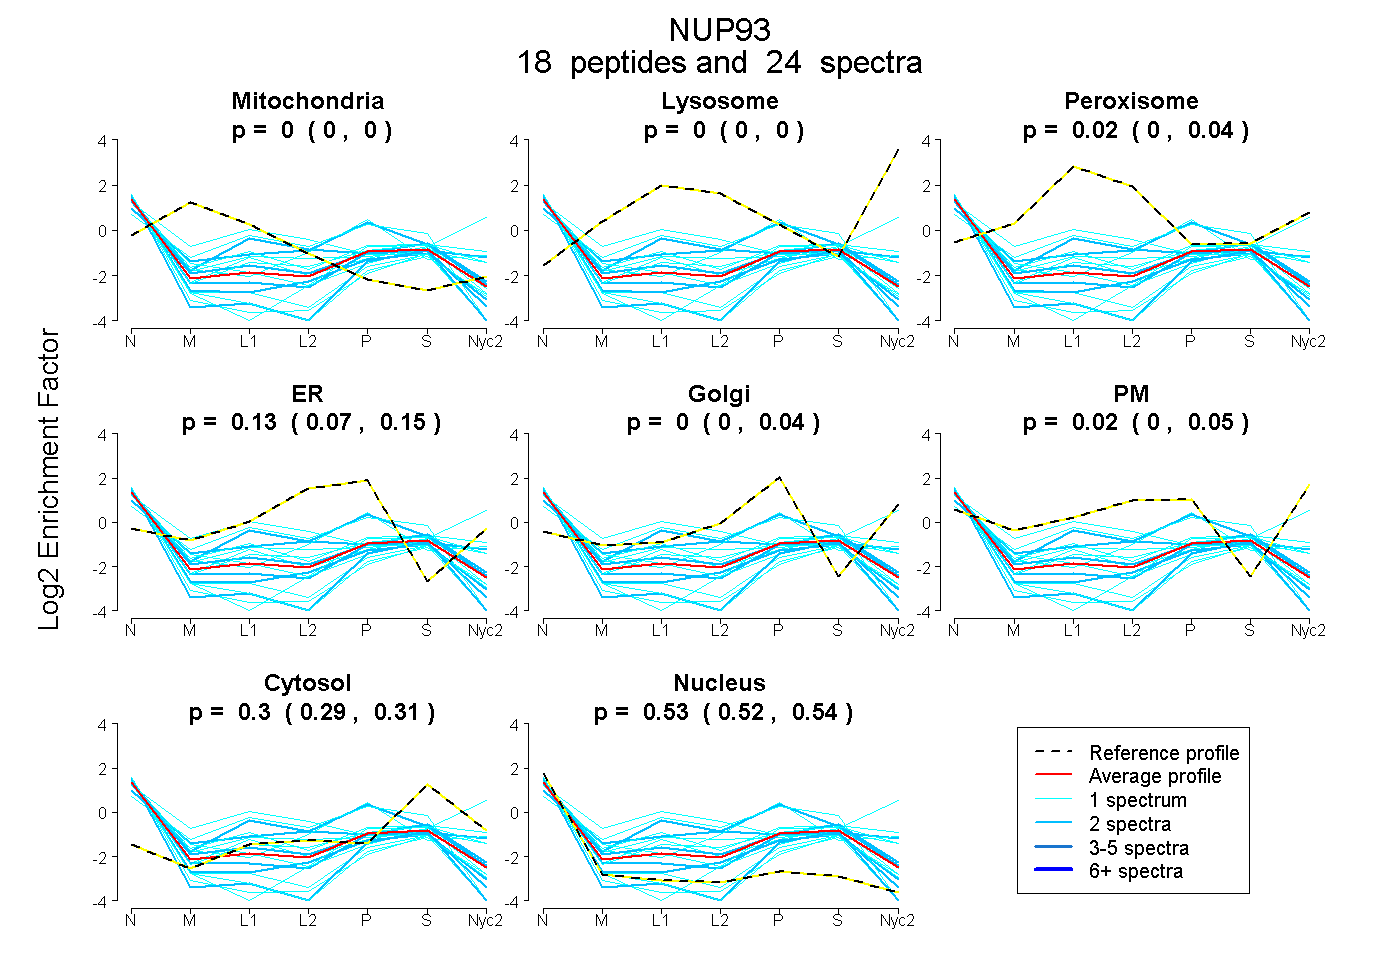 |
0.000
0.000 | 0.000 |
0.000
0.000 | 0.000 |
|
0.015
0.000 | 0.041 |
0.130
0.072 | 0.152 |
0.000
0.000 | 0.037 |
0.020
0.000 | 0.053 |
0.303
0.286 | 0.312 |
0.532
0.521 | 0.543 |
|
| | | Plot |
Mito |
|
Lyso or Perox |
|
ER |
Golgi |
PM |
Cytosol |
Nucleus |
|
| Expt B |
2
peptides |
3
spectra |
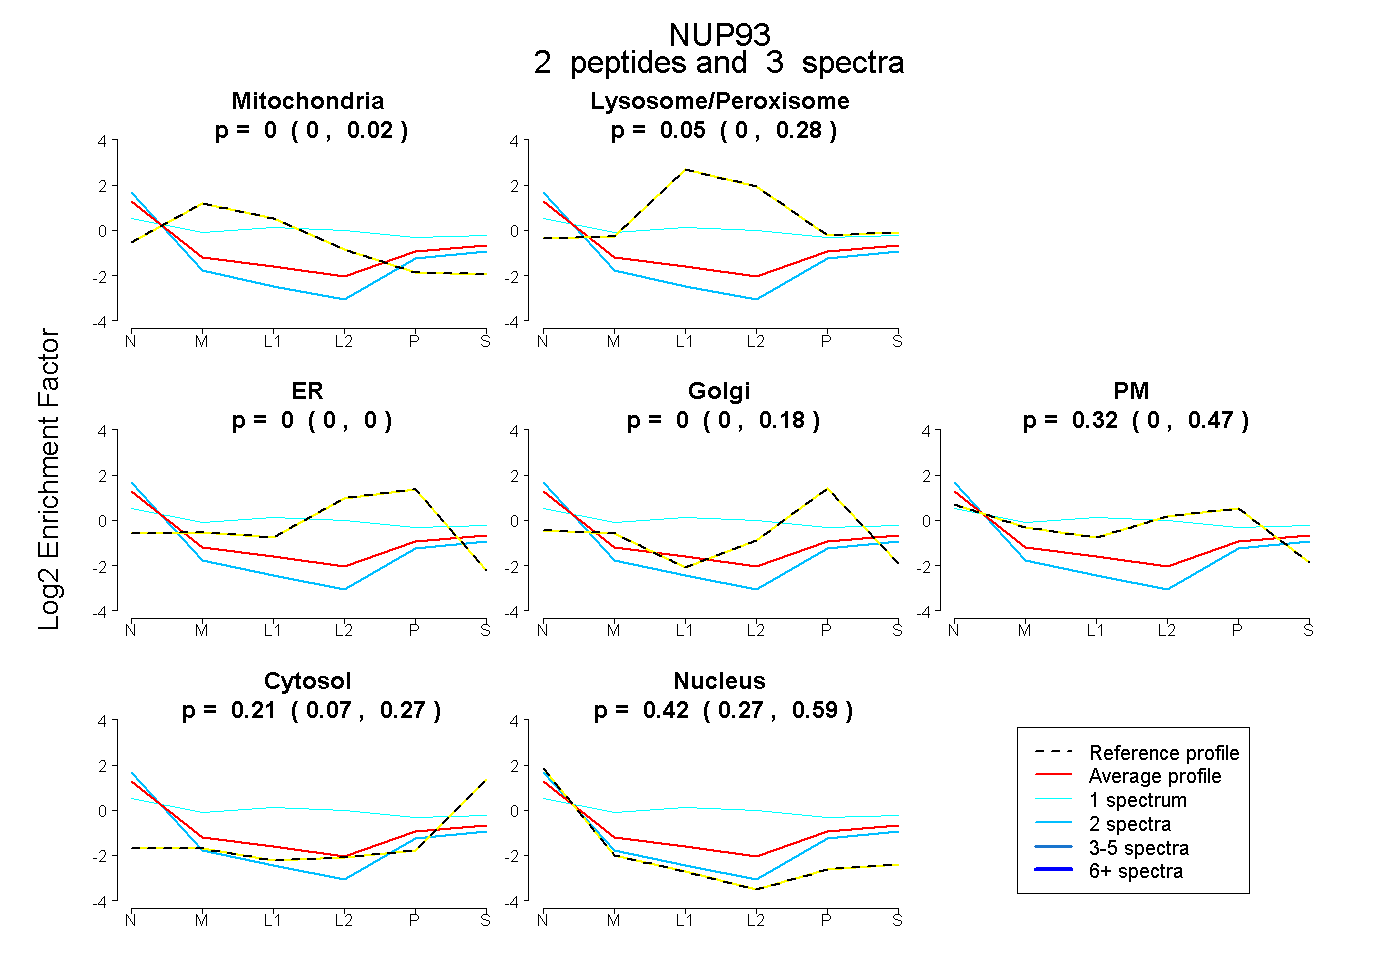 |
0.000
0.000 | 0.017 |
|
0.052
0.000 | 0.279 |
|
0.000
0.000 | 0.000 |
0.000
0.000 | 0.184 |
0.321
0.000 | 0.469 |
0.210
0.068 | 0.271 |
0.418
0.271 | 0.587 |
|
| 1 spectrum, QALGYLEQSYK |
0.038 |
|
0.347 |
|
0.000 |
0.000 |
0.392 |
0.165 |
0.058 |
|
| 2 spectra, AFDIIDR |
0.000 |
|
0.000 |
|
0.000 |
0.108 |
0.060 |
0.178 |
0.654 |
|
| | | Plot |
|
Lyso |
|
|
|
|
|
|
|
Other |
| Expt C |
4
peptides |
6
spectra |
 |
|
0.000
0.000 | 0.000 |
|
|
|
|
|
|
|
1.000
1.000 | 1.000 |