 18
18peptides
spectra
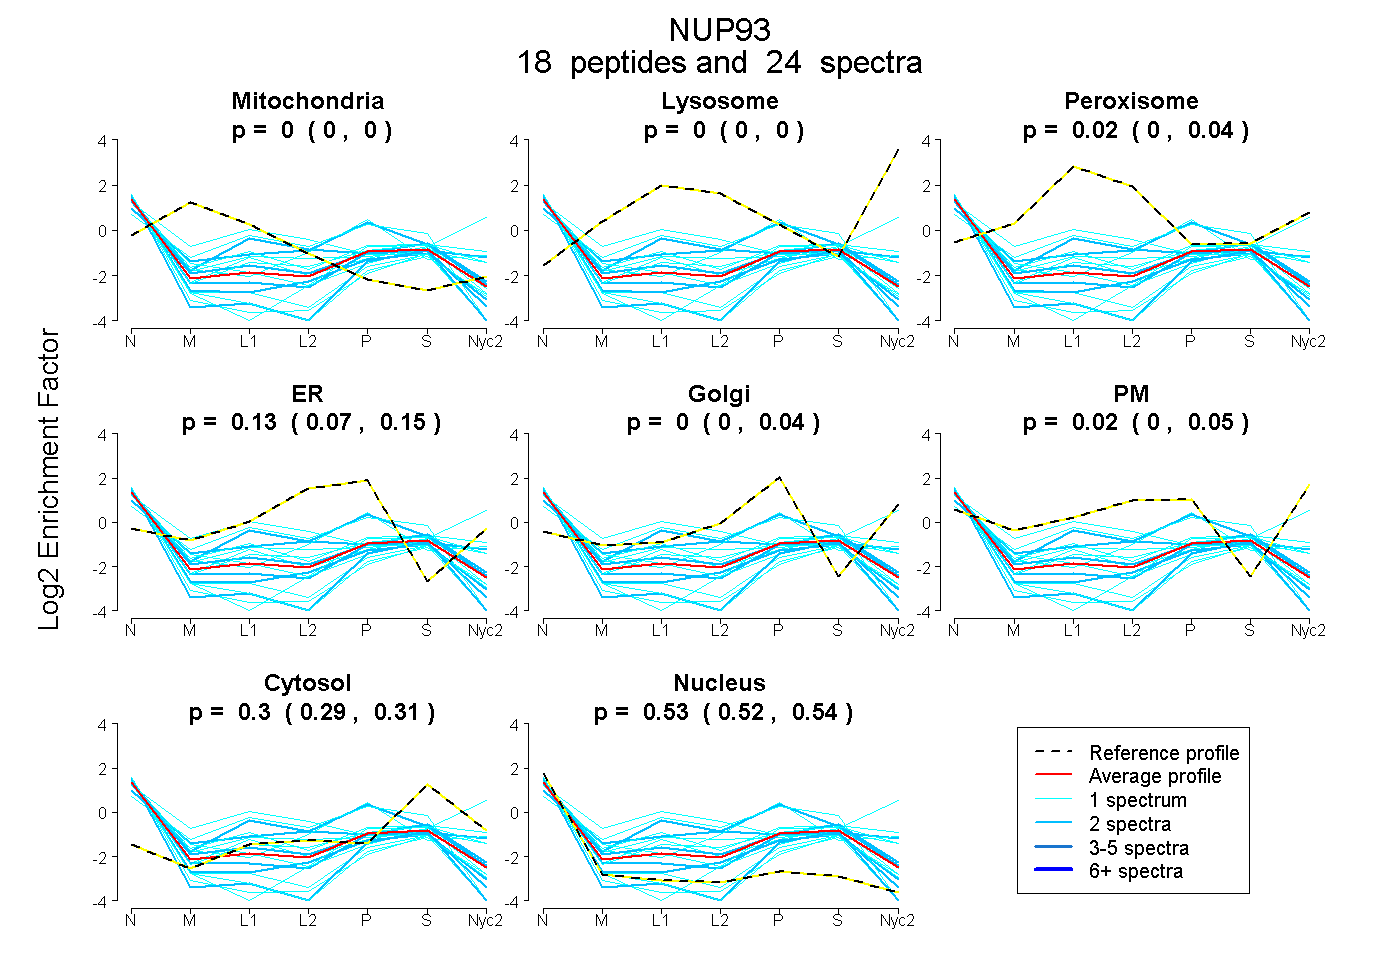
0.000 | 0.000
0.000 | 0.000
0.000 | 0.041
0.072 | 0.152
0.000 | 0.037
0.000 | 0.053
0.286 | 0.312
0.521 | 0.543
2peptides
spectra
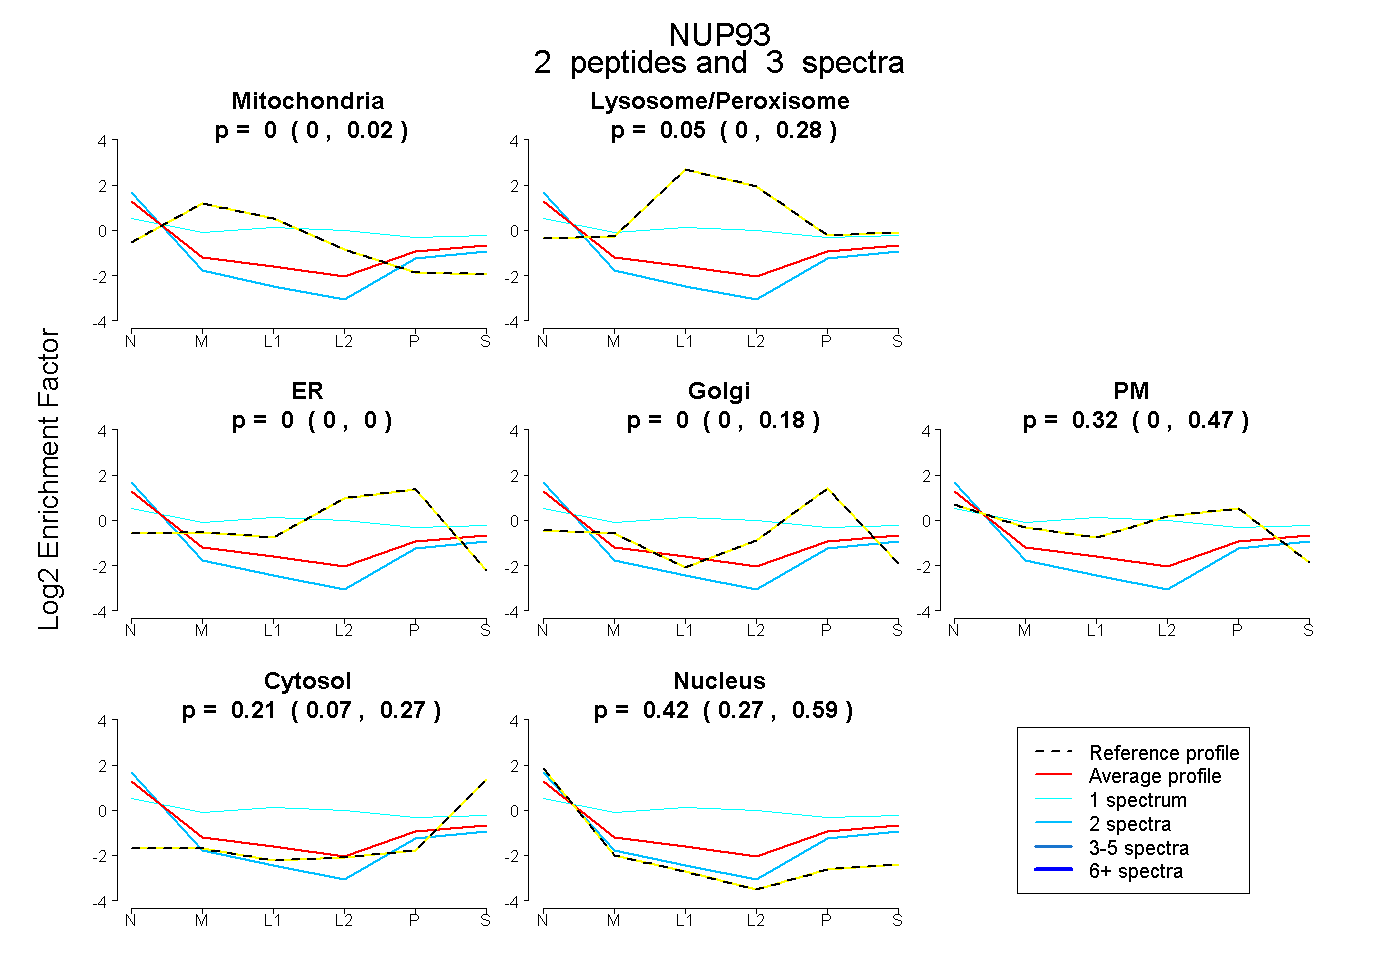
0.000 | 0.017
0.000 | 0.279
0.000 | 0.000
0.000 | 0.184
0.000 | 0.469
0.068 | 0.271
0.271 | 0.587
4peptides
spectra

0.000 | 0.000
1.000 | 1.000