 2
2peptides
spectra

0.485 | 0.595
0.147 | 0.337
0.000 | 0.076
0.000 | 0.000
0.000 | 0.000
0.063 | 0.201
0.000 | 0.021
0.001 | 0.073
1peptide
spectrum
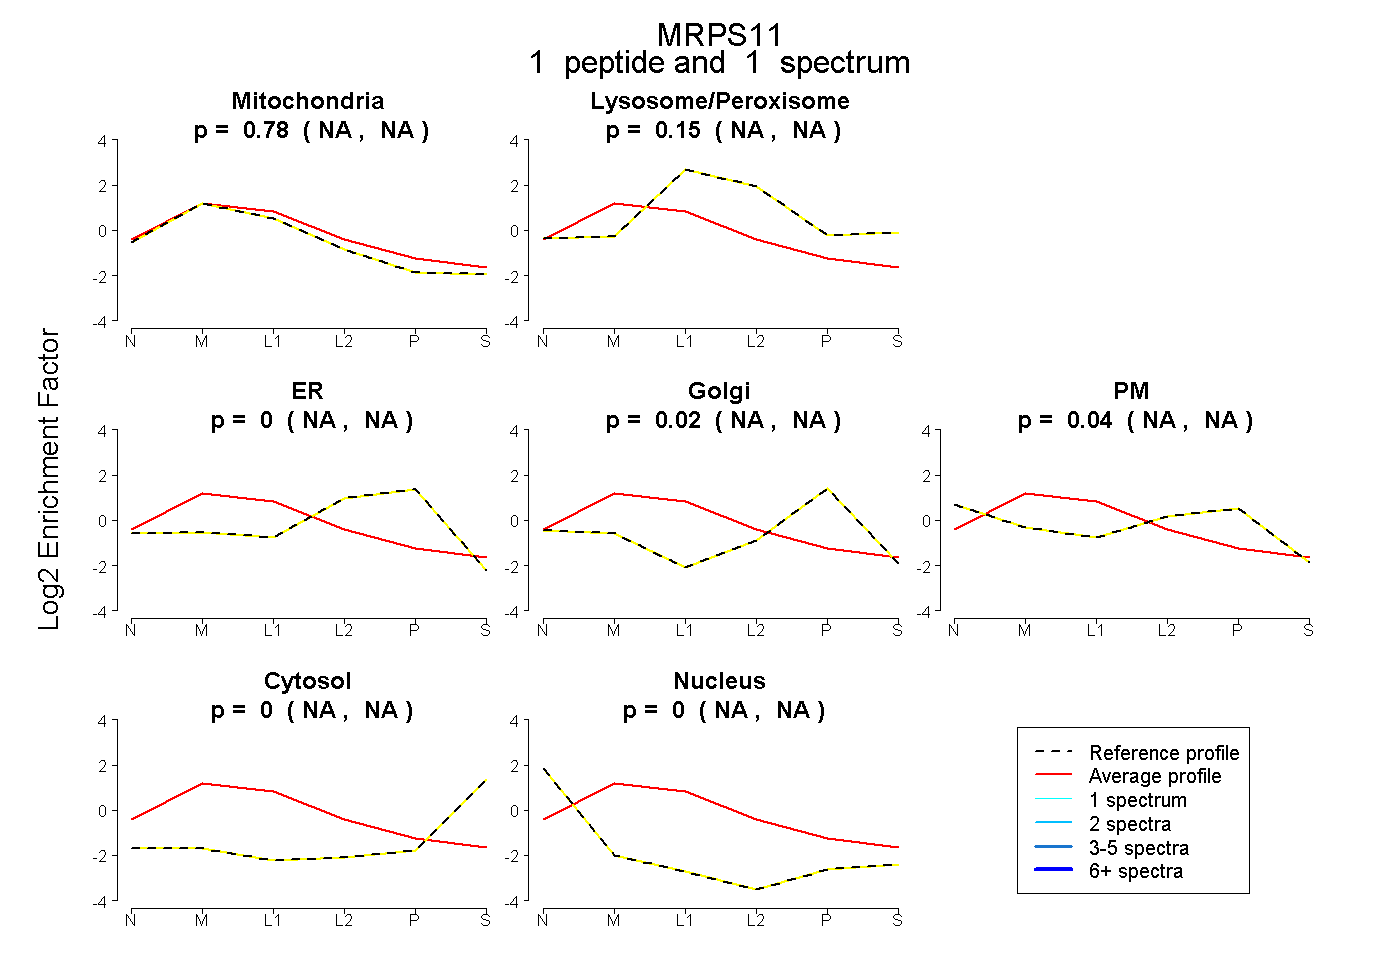
NA | NA
NA | NA
NA | NA
NA | NA
NA | NA
NA | NA
NA | NA
5peptides
spectra
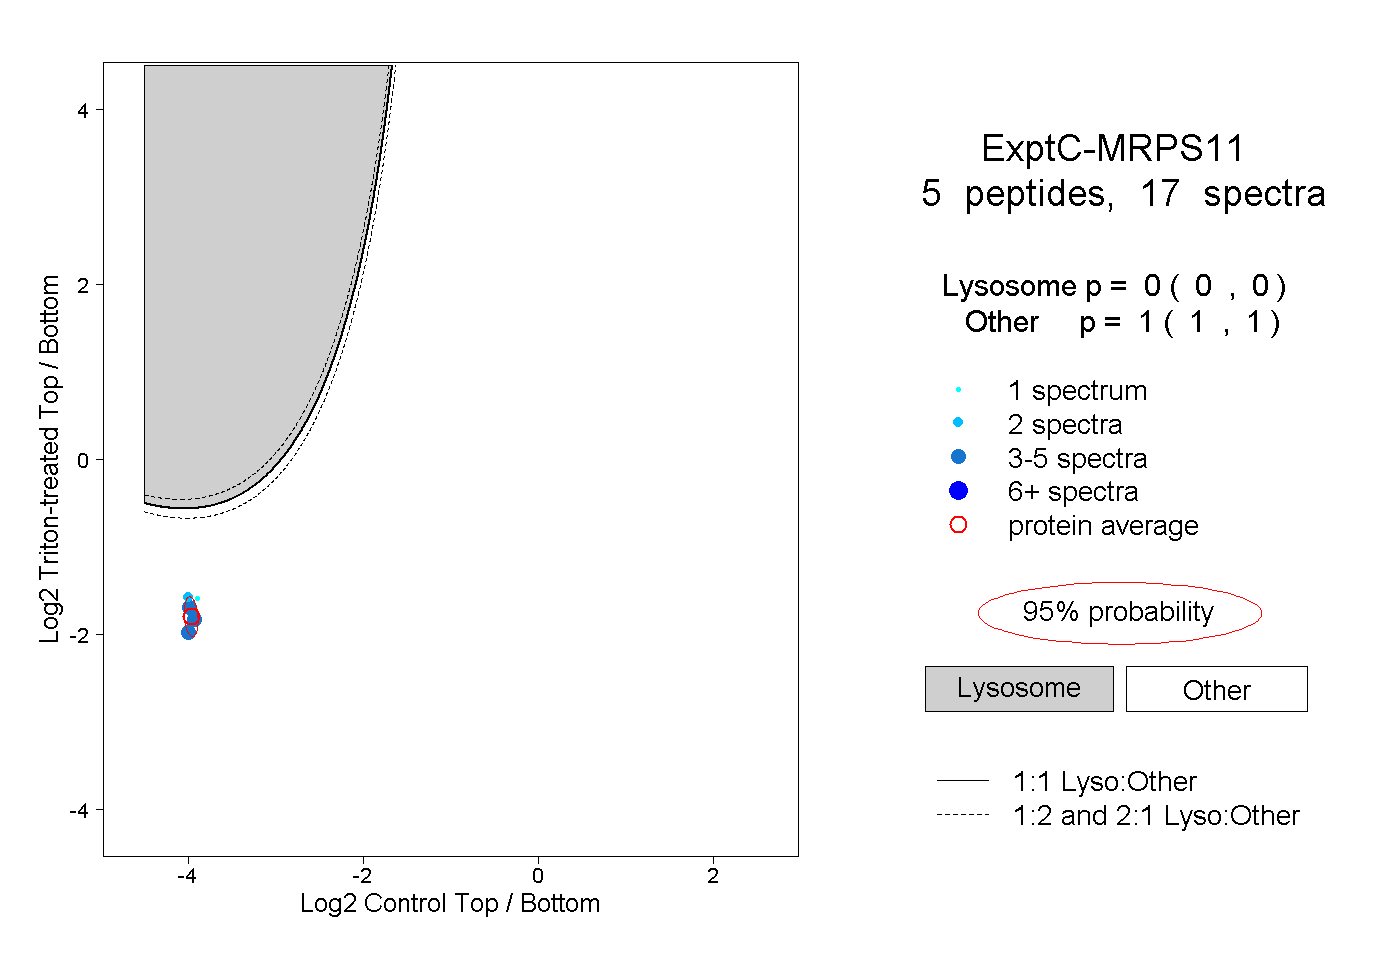
0.000 | 0.000
1.000 | 1.000
1peptide
spectra
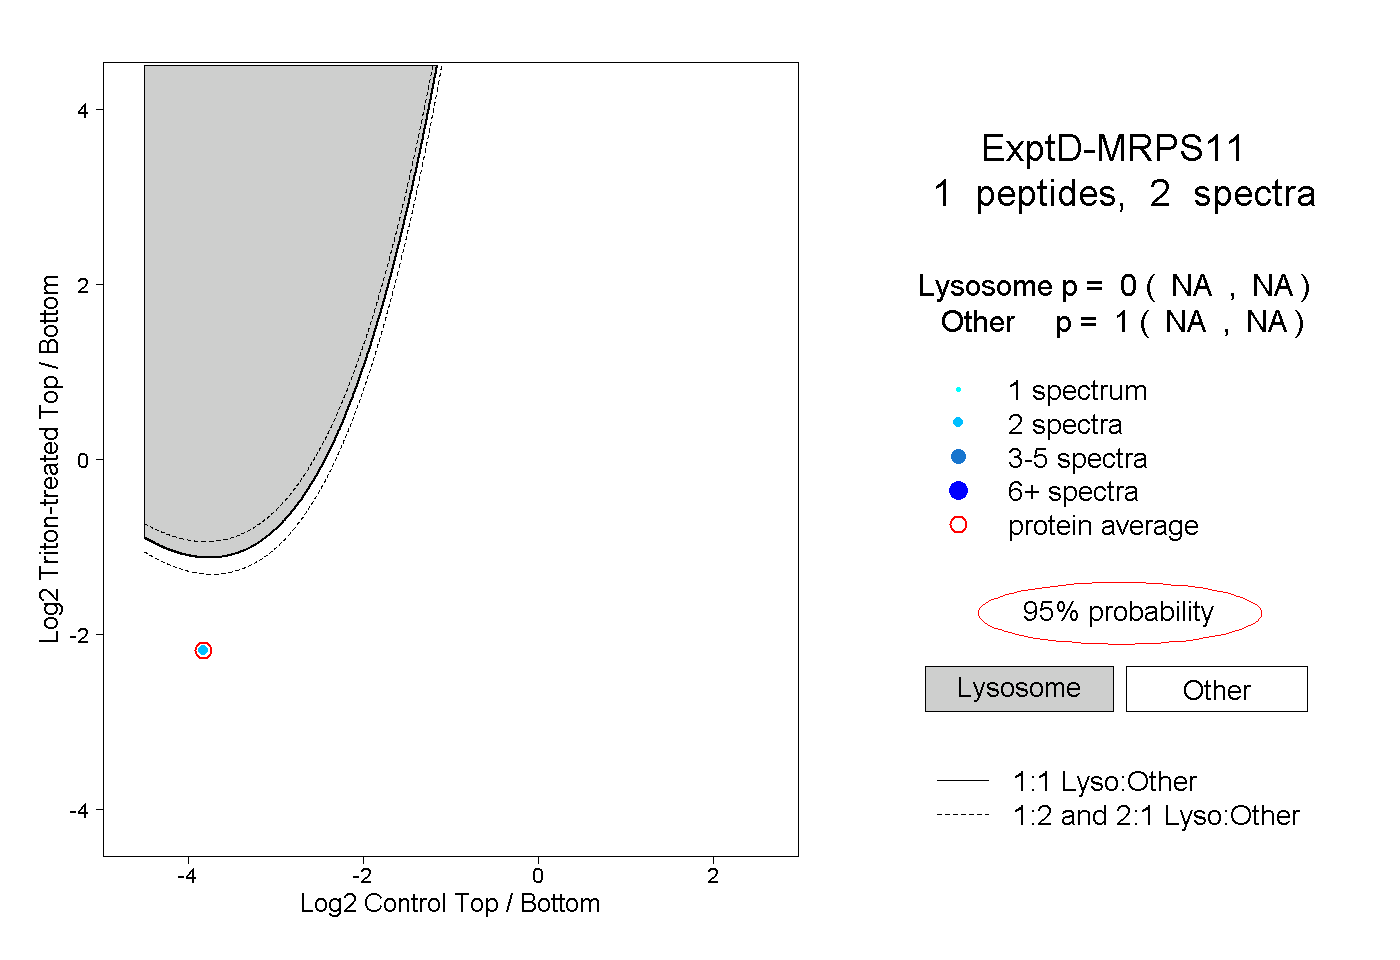
NA | NA
NA | NA