 3
3peptides
spectra
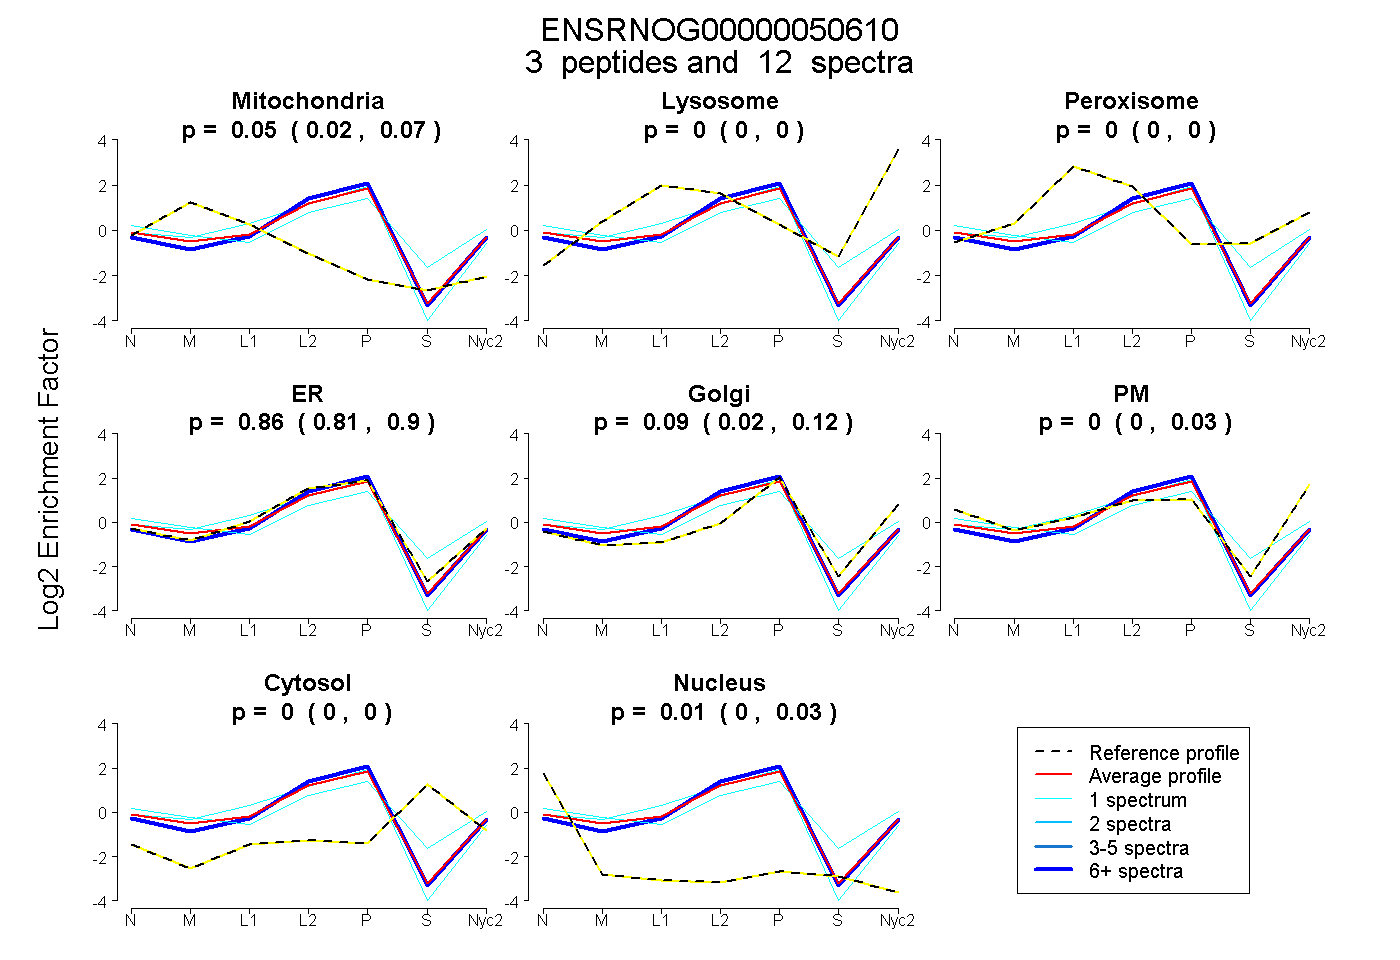
0.016 | 0.066
0.000 | 0.000
0.000 | 0.000
0.808 | 0.898
0.021 | 0.121
0.000 | 0.032
0.000 | 0.000
0.000 | 0.026
4peptides
spectra
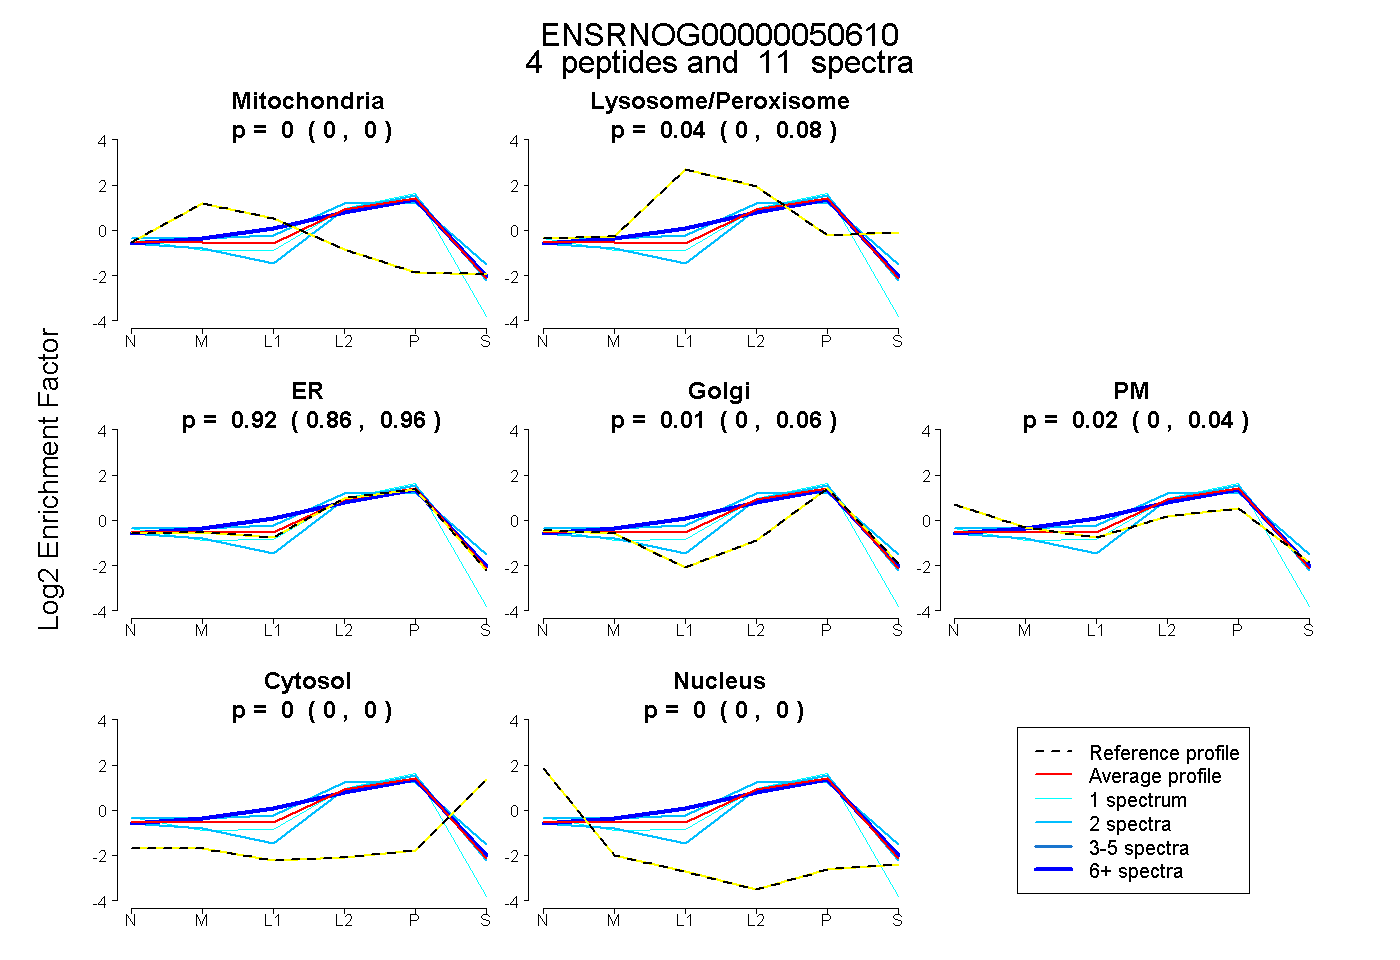
0.000 | 0.000
0.000 | 0.084
0.857 | 0.963
0.000 | 0.062
0.000 | 0.042
0.000 | 0.000
0.000 | 0.000
5peptides
spectra

0.000 | 0.000
1.000 | 1.000
2peptides
spectra
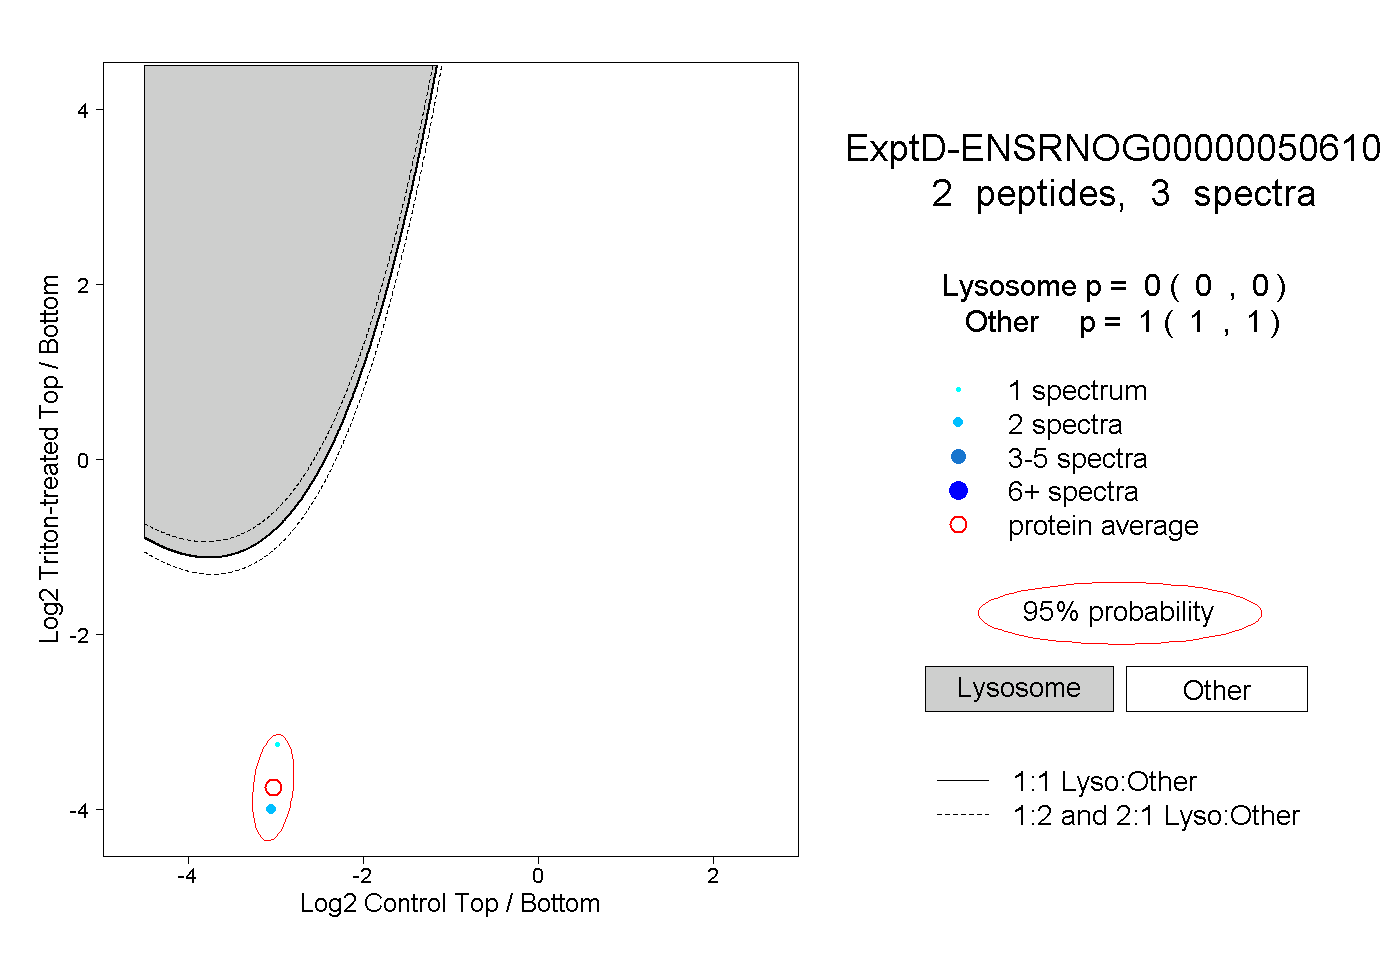
0.000 | 0.000
1.000 | 1.000