 2
2peptides
spectra
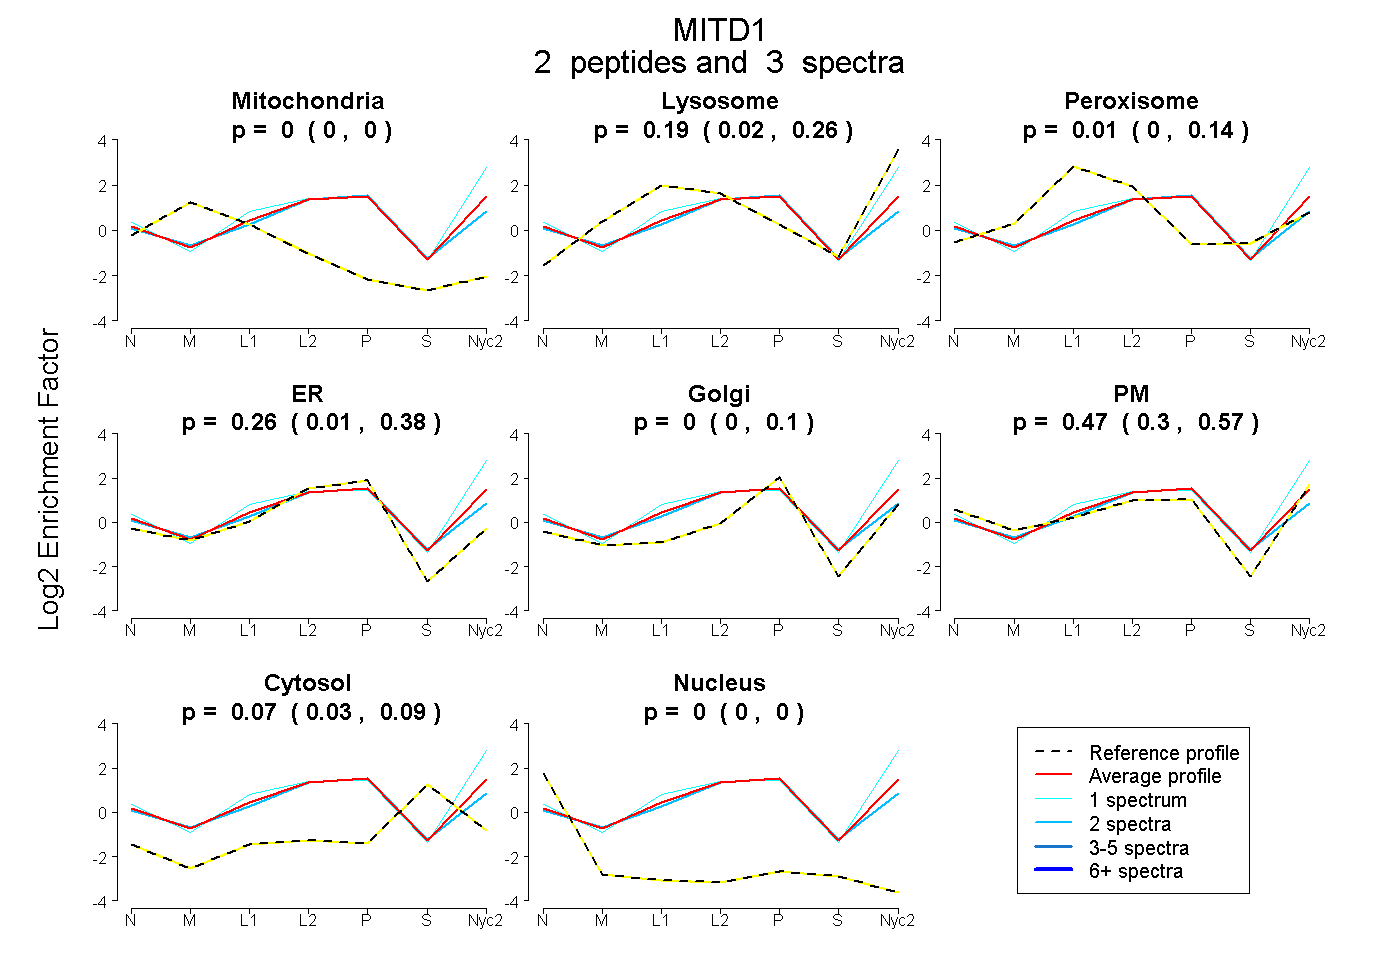
0.000 | 0.000
0.022 | 0.262
0.000 | 0.135
0.012 | 0.375
0.000 | 0.100
0.301 | 0.572
0.027 | 0.089
0.000 | 0.000
| Plot | Mito | Lyso | Perox | ER | Golgi | PM | Cytosol | Nucleus | |||||
| Expt A |
2 peptides |
3 spectra |
|
0.000 0.000 | 0.000 |
0.190 0.022 | 0.262 |
0.010 0.000 | 0.135 |
0.259 0.012 | 0.375 |
0.000 0.000 | 0.100 |
0.470 0.301 | 0.572 |
0.071 0.027 | 0.089 |
0.000 0.000 | 0.000 |
| 1 spectrum, IEENATGFSYESLFR | 0.000 | 0.316 | 0.000 | 0.000 | 0.001 | 0.684 | 0.000 | 0.000 | ||
| 2 spectra, AVELDAESR | 0.000 | 0.098 | 0.063 | 0.418 | 0.000 | 0.324 | 0.096 | 0.000 |
| Plot | Lyso | Other | |||||||||||
| Expt C |
3 peptides |
8 spectra |
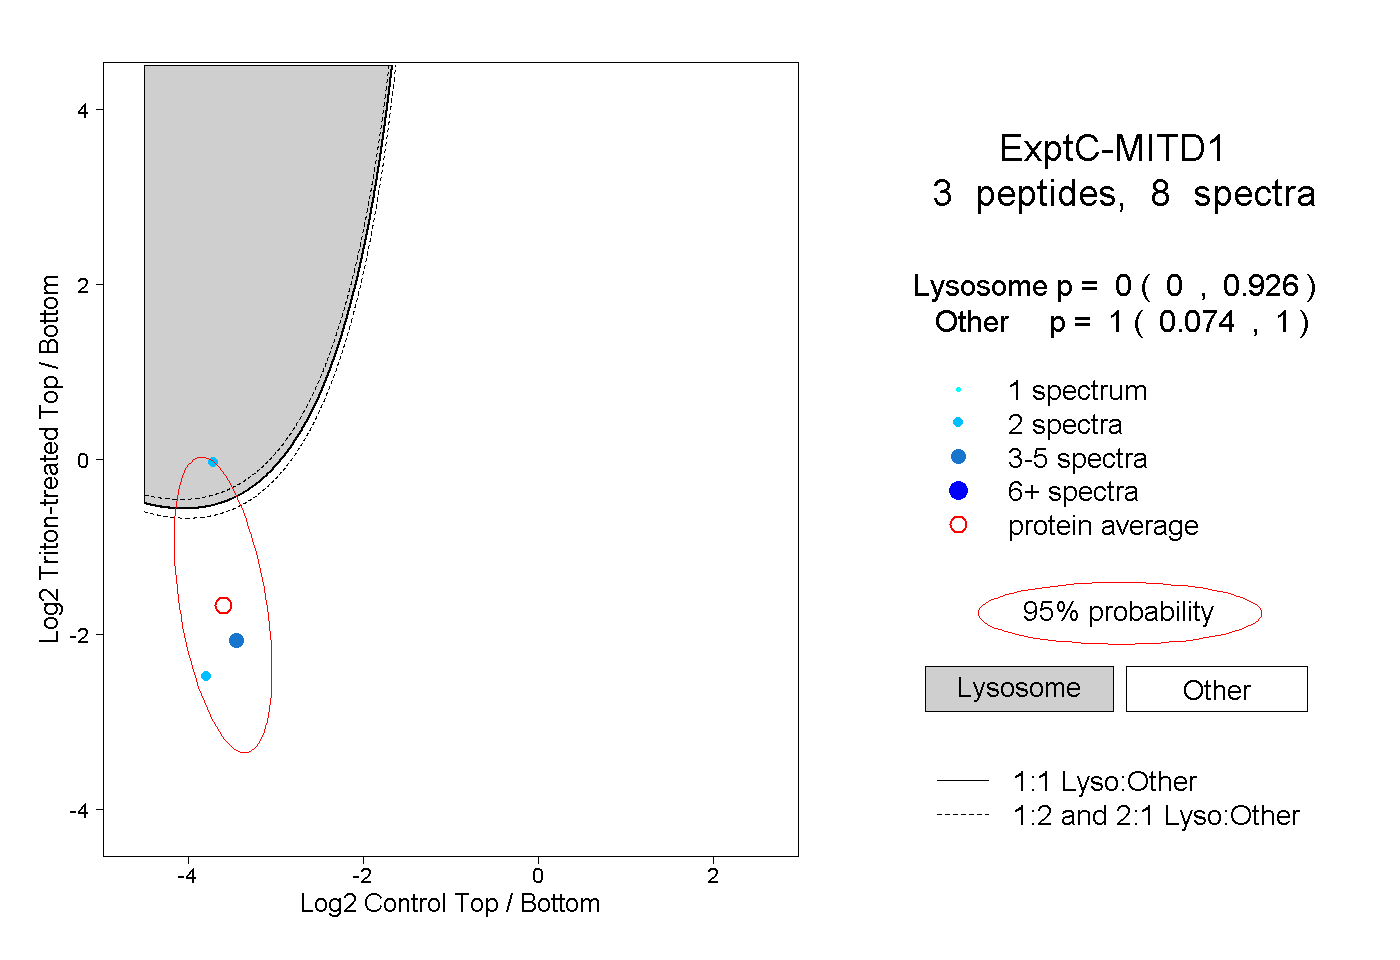 |
0.000 0.000 | 0.926 |
1.000 0.074 | 1.000 |