 3
3peptides
spectra
0.000 | 0.098
0.000 | 0.000
0.000 | 0.101
0.000 | 0.107
0.000 | 0.000
0.000 | 0.020
0.780 | 0.931
0.000 | 0.110
1peptide
spectrum

NA | NA
NA | NA
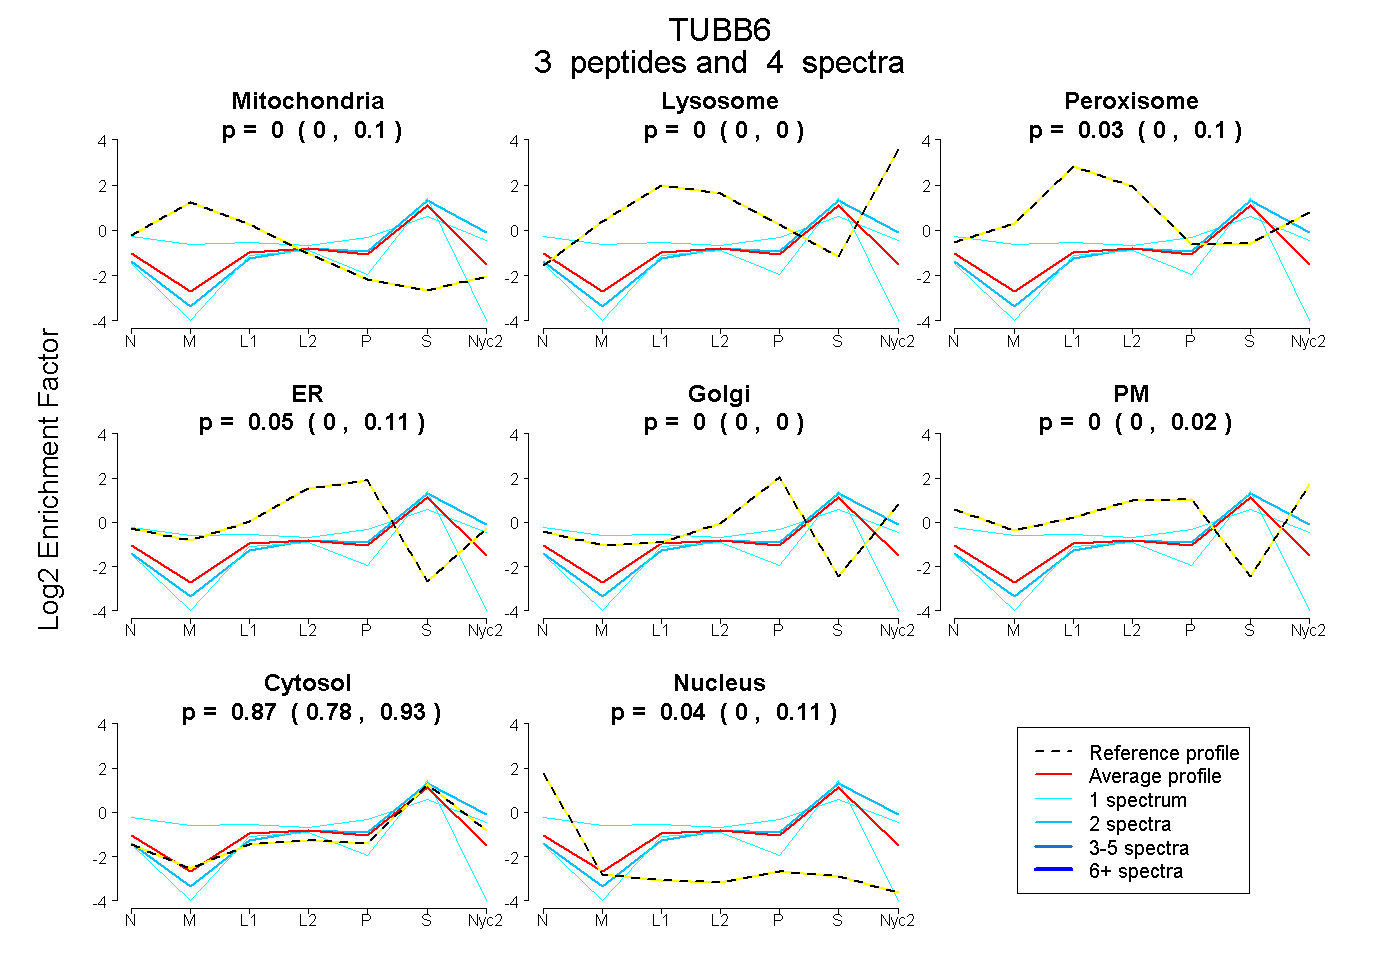
| Plot | Mito | Lyso | Perox | ER | Golgi | PM | Cytosol | Nucleus | |||||
| Expt A |
3 peptides |
4 spectra |
|
0.000 0.000 | 0.098 |
0.000 0.000 | 0.000 |
0.034 0.000 | 0.101 |
0.053 0.000 | 0.107 |
0.000 0.000 | 0.000 |
0.000 0.000 | 0.020 |
0.873 0.780 | 0.931 |
0.039 0.000 | 0.110 |
||
| Plot | Lyso | Other | |||||||||||
| Expt C |
1 peptide |
1 spectrum |
|
0.000 NA | NA |
1.000 NA | NA |