 2
2peptides
spectra
0.388 | 0.865
0.000 | 0.140
0.000 | 0.024
0.000 | 0.109
0.000 | 0.038
0.000 | 0.000
0.000 | 0.192
0.032 | 0.388
1peptide
spectrum
NA | NA
NA | NA
| Plot | Mito | Lyso | Perox | ER | Golgi | PM | Cytosol | Nucleus | |||||
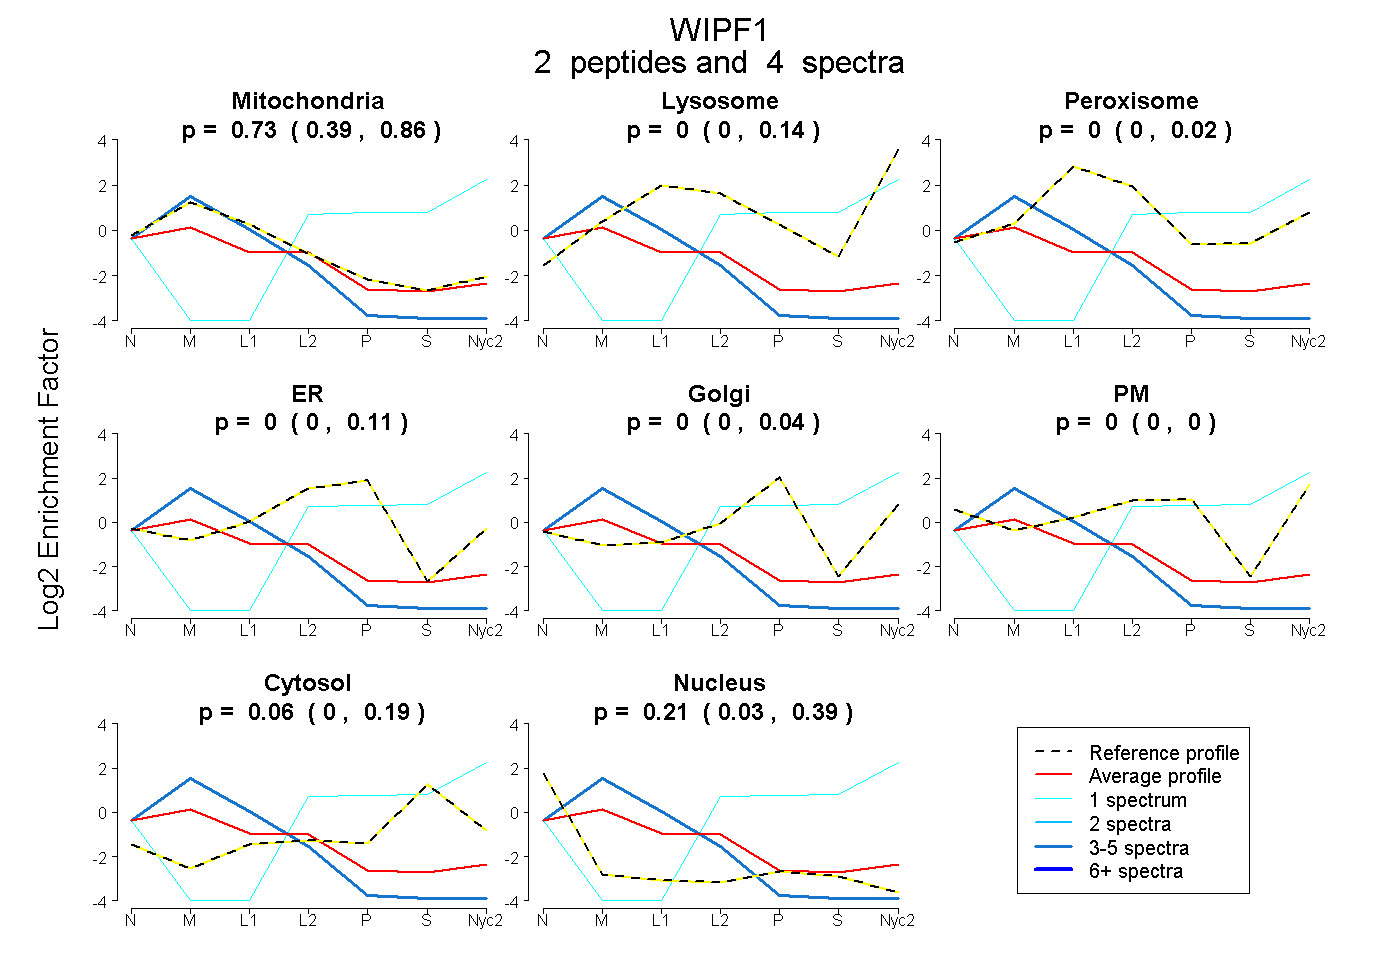
| Expt A |
2 peptides |
4 spectra |
|
0.733 0.388 | 0.865 |
0.000 0.000 | 0.140 |
0.000 0.000 | 0.024 |
0.000 0.000 | 0.109 |
0.000 0.000 | 0.038 |
0.000 0.000 | 0.000 |
0.061 0.000 | 0.192 |
0.206 0.032 | 0.388 |
||
| Plot | Lyso | Other | |||||||||||
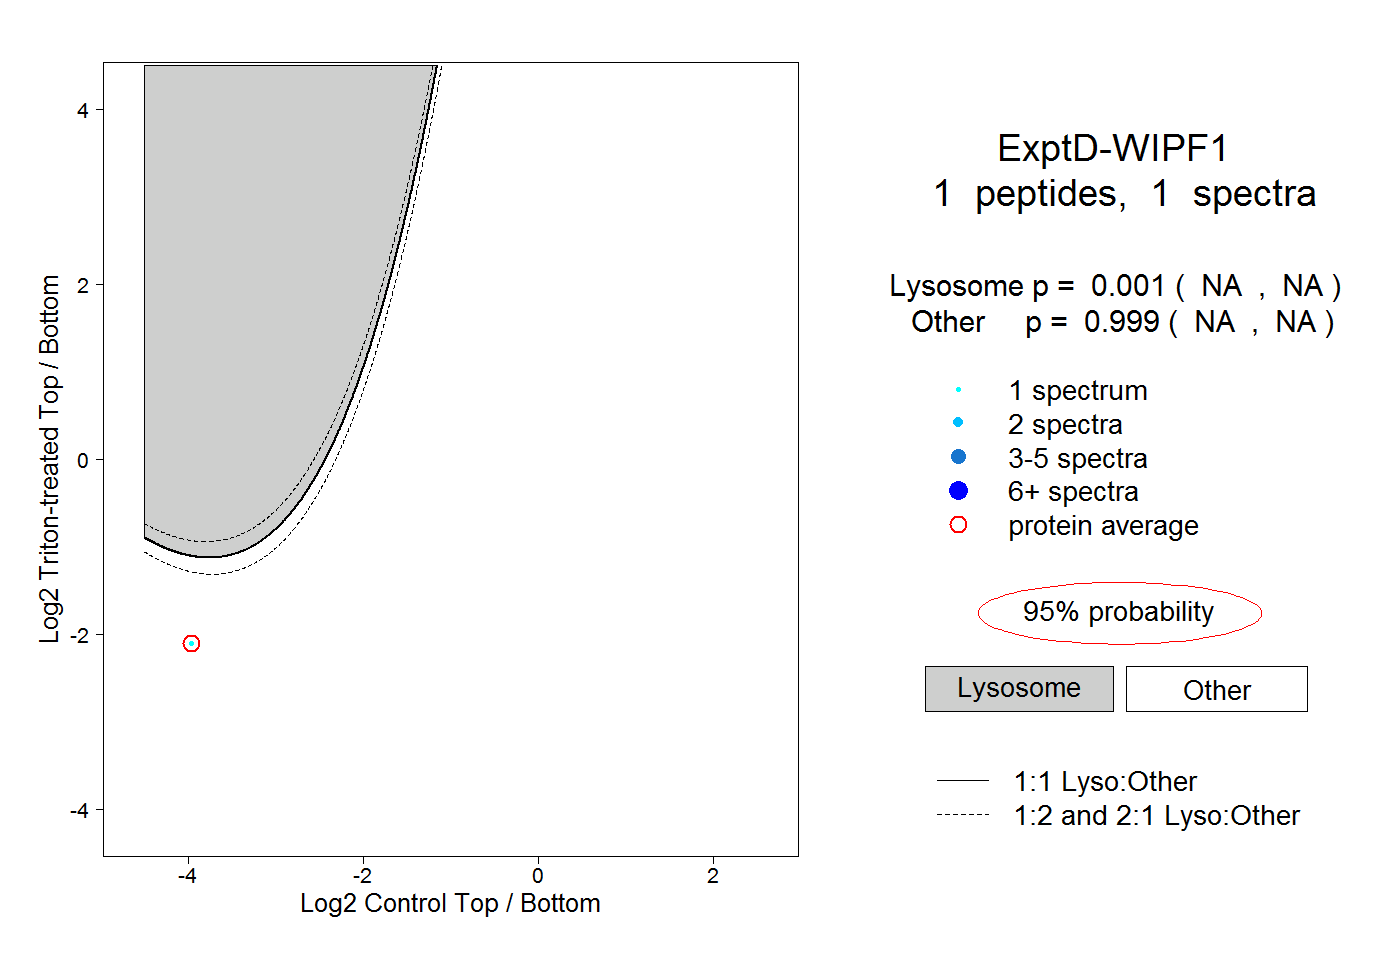
| Expt D |
1 peptide |
1 spectrum |
|
0.001 NA | NA |
0.999 NA | NA |