 11
11peptides
spectra
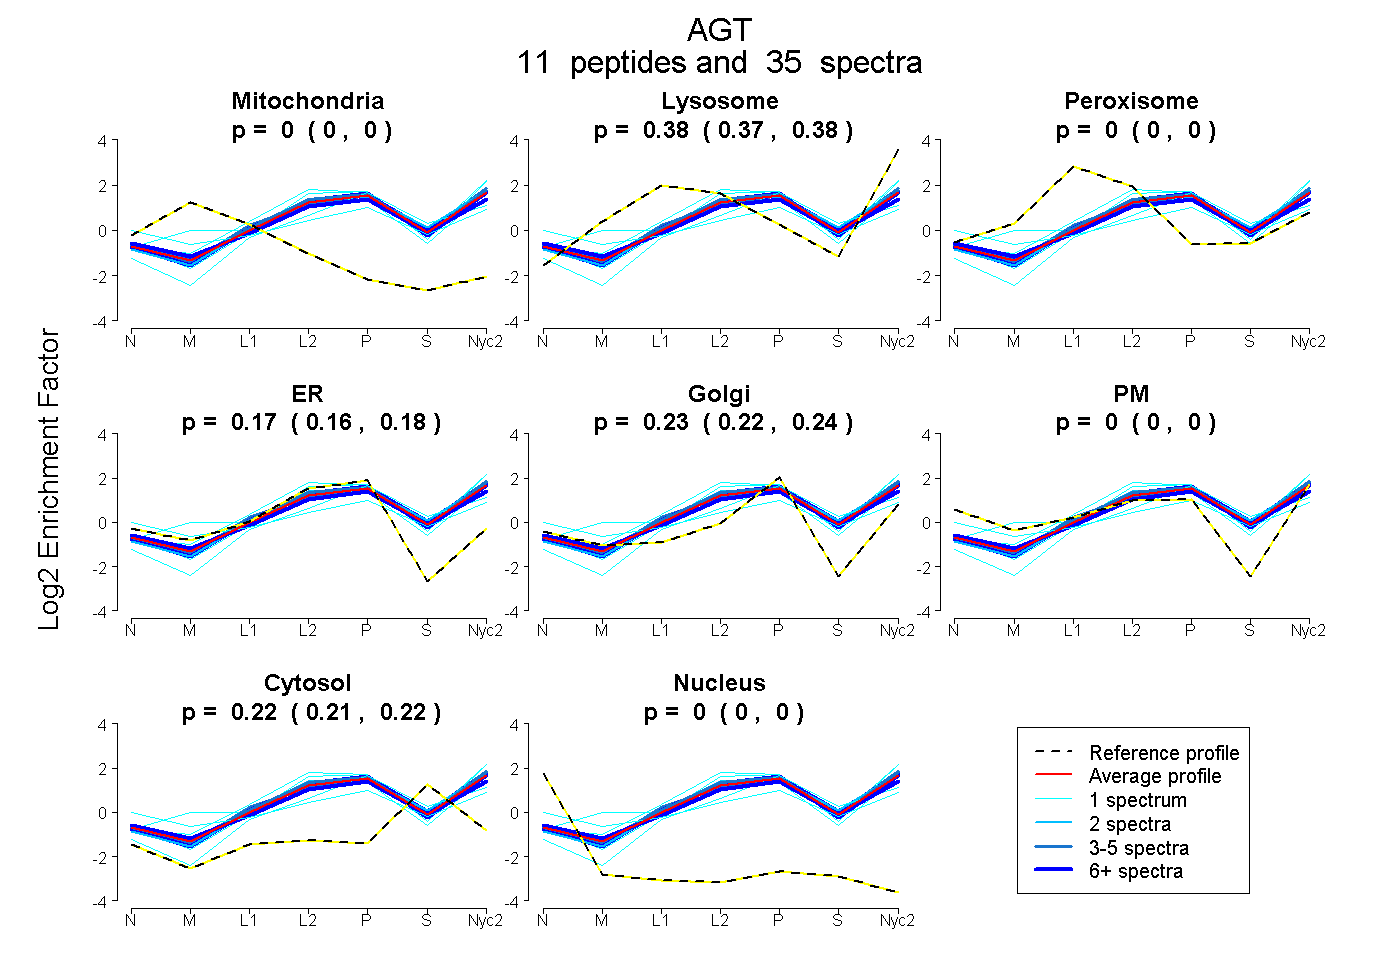
0.000 | 0.000
0.373 | 0.382
0.000 | 0.000
0.159 | 0.180
0.224 | 0.244
0.000 | 0.000
0.214 | 0.221
0.000 | 0.000
5peptides
spectra
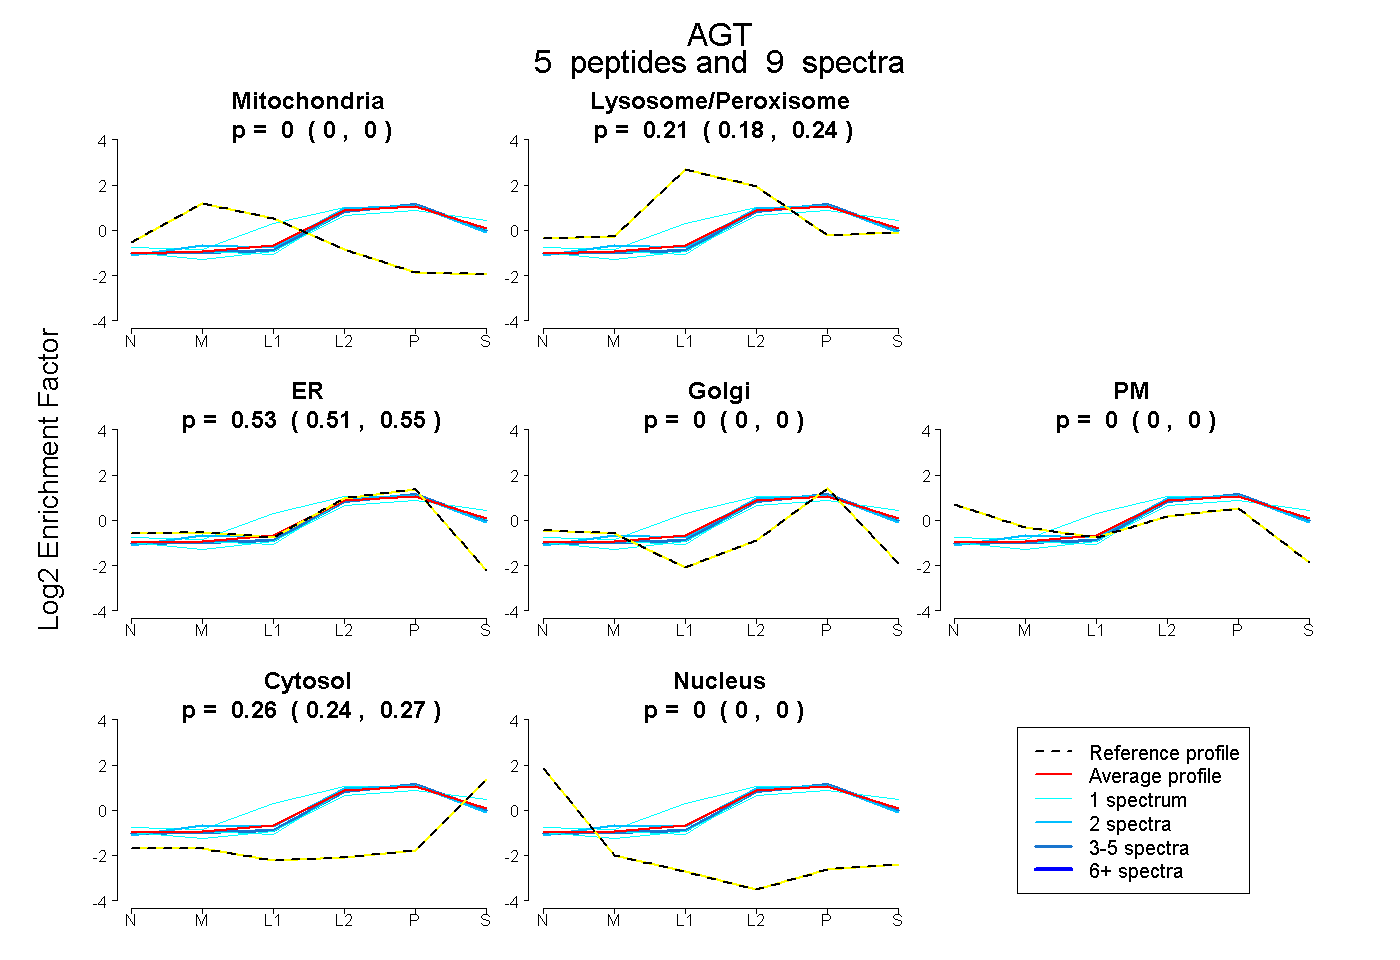
0.000 | 0.000
0.183 | 0.240
0.505 | 0.550
0.000 | 0.000
0.000 | 0.000
0.245 | 0.267
0.000 | 0.000
7peptides
spectra
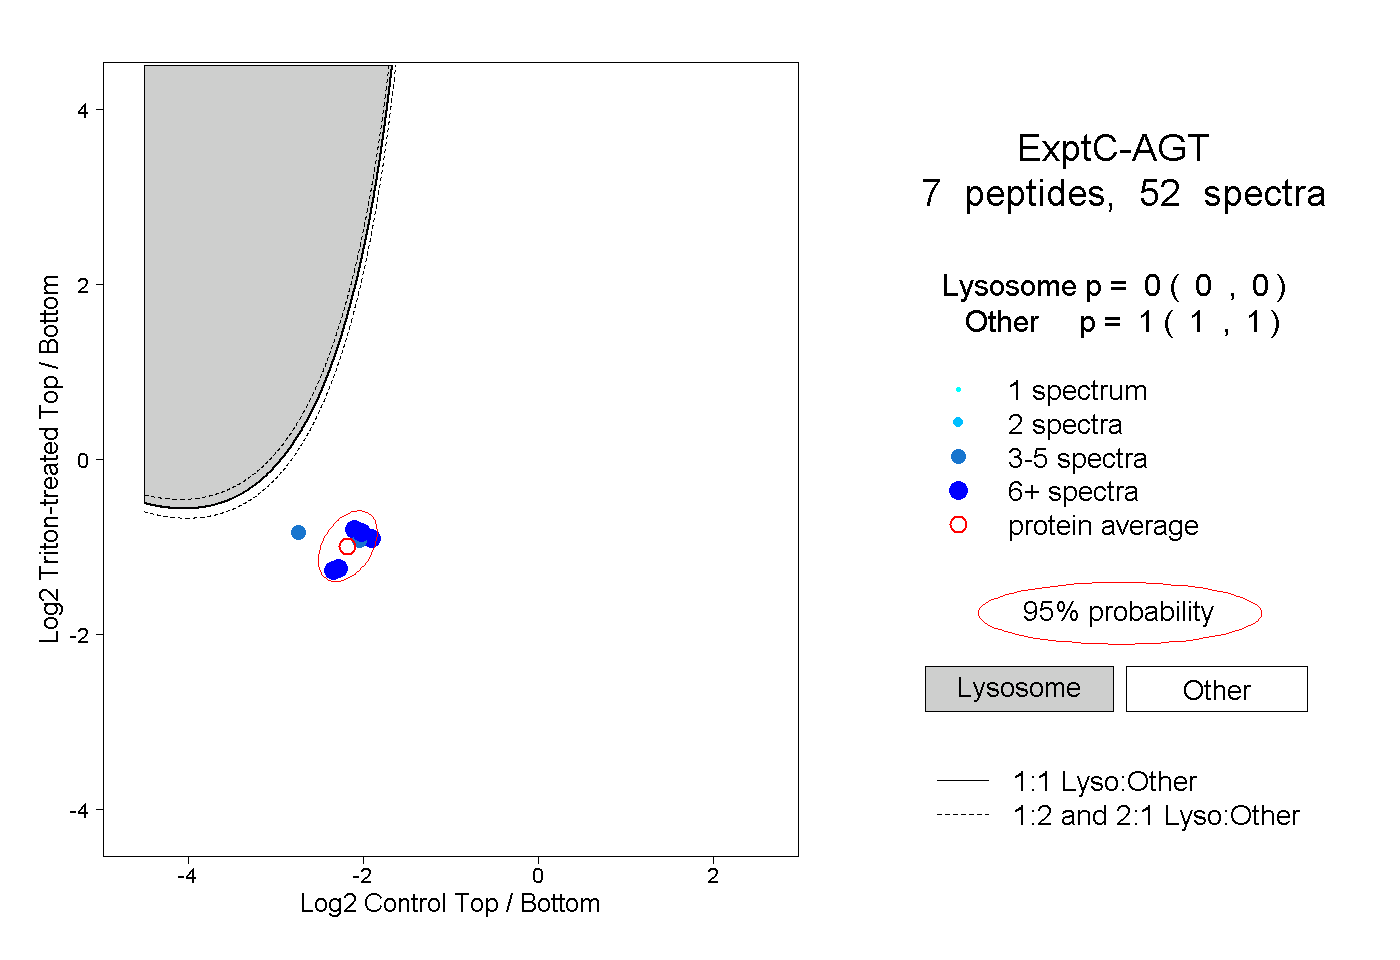
0.000 | 0.000
1.000 | 1.000
6peptides
spectra
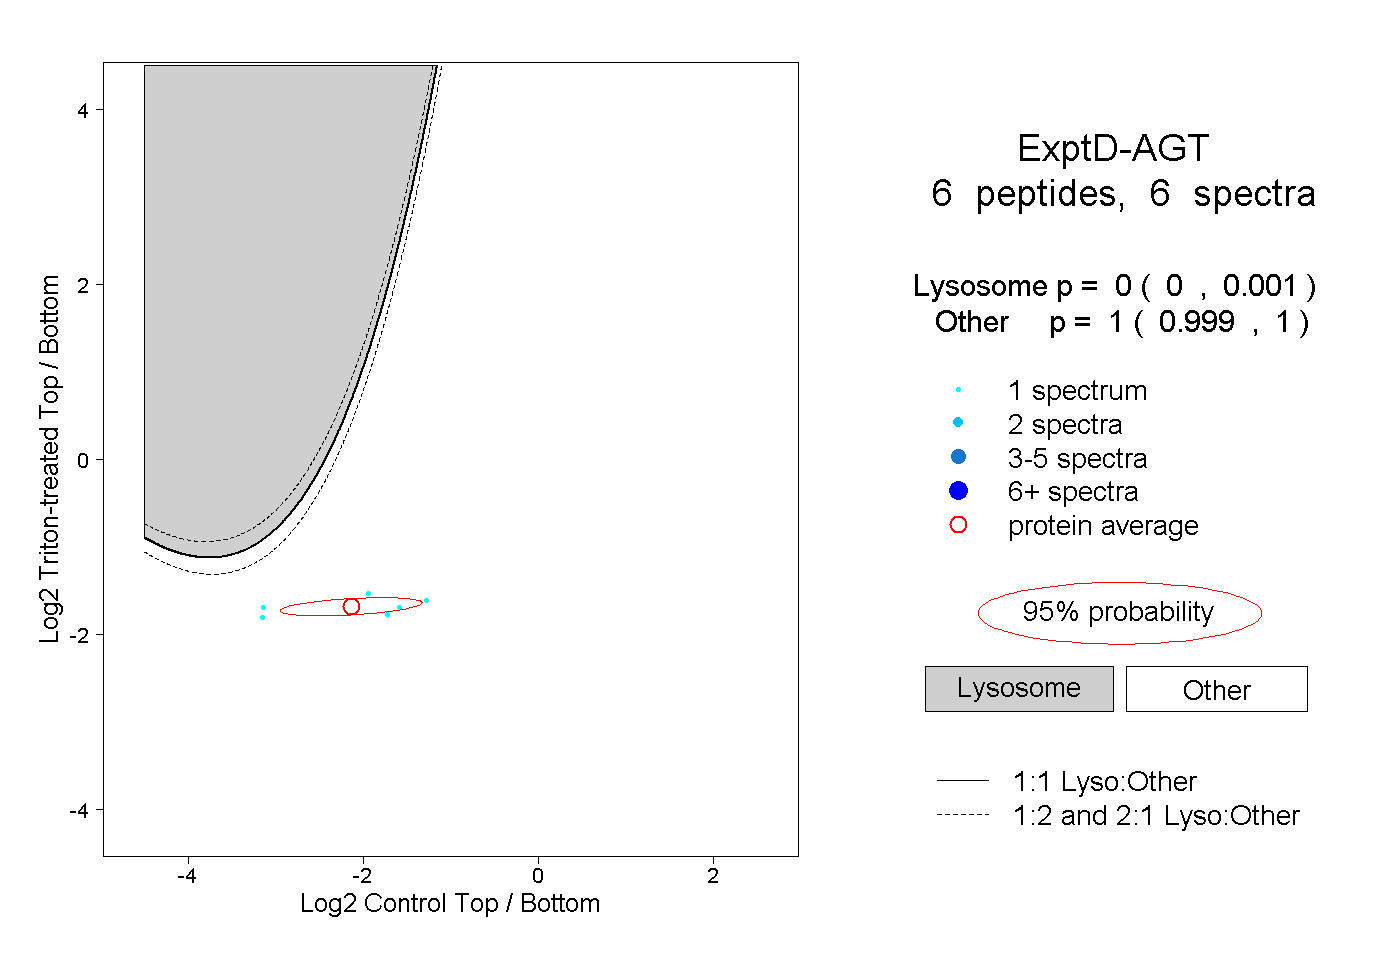
0.000 | 0.001
0.999 | 1.000