 11
11peptides
spectra
0.000 | 0.000
0.000 | 0.000
0.000 | 0.000
0.000 | 0.000
0.000 | 0.000
0.000 | 0.000
0.957 | 0.963
0.037 | 0.042
| Plot | Mito | Lyso | Perox | ER | Golgi | PM | Cytosol | Nucleus | |||||
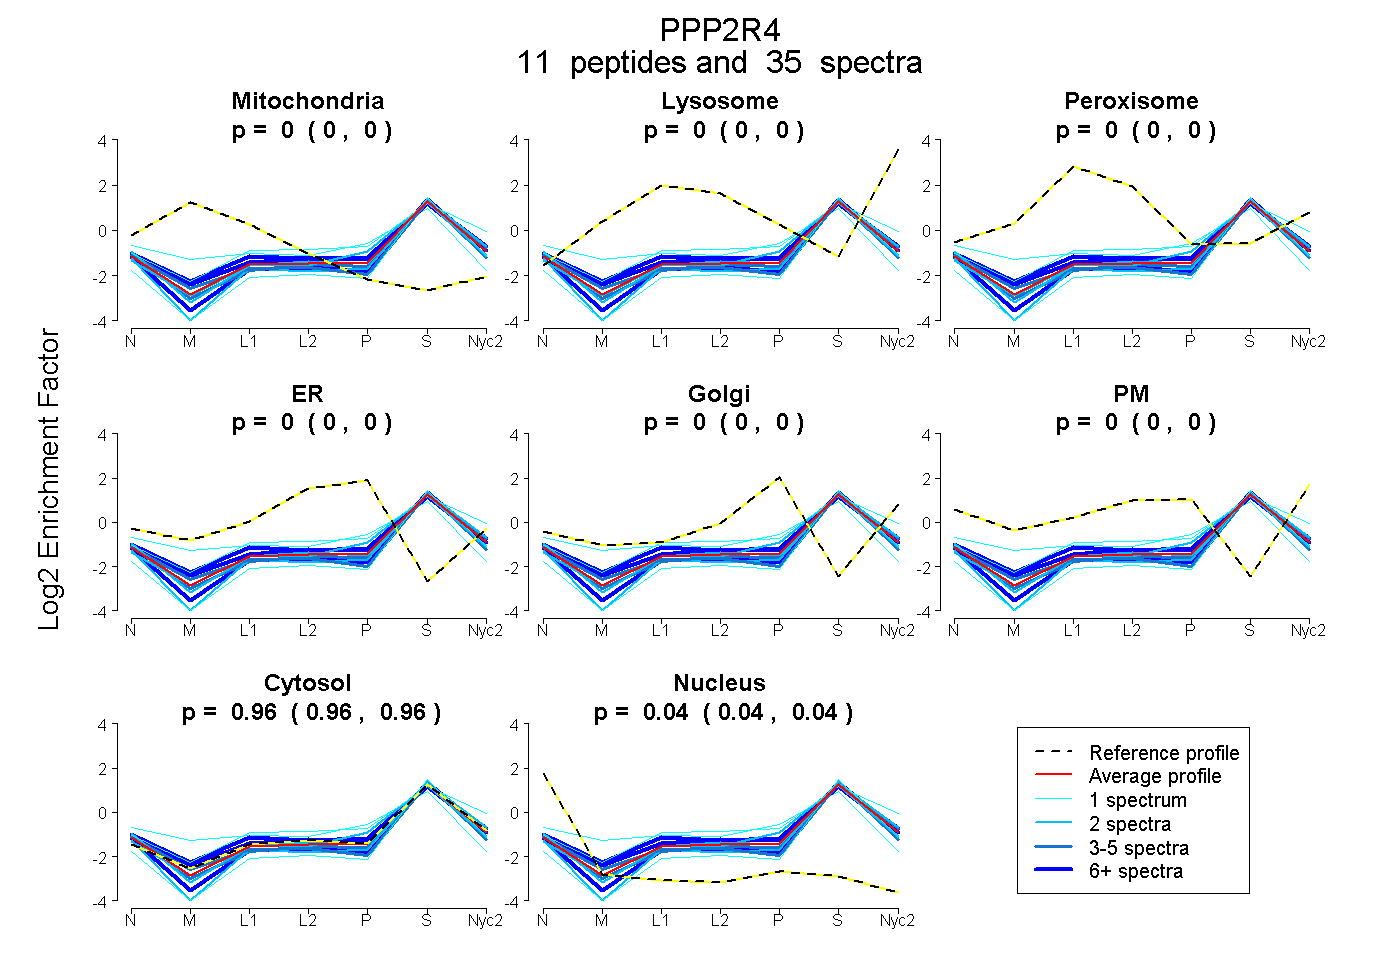
| Expt A |
11 peptides |
35 spectra |
|
0.000 0.000 | 0.000 |
0.000 0.000 | 0.000 |
0.000 0.000 | 0.000 |
0.000 0.000 | 0.000 |
0.000 0.000 | 0.000 |
0.000 0.000 | 0.000 |
0.960 0.957 | 0.963 |
0.040 0.037 | 0.042 |
| 4 spectra, HFVDEK | 0.000 | 0.000 | 0.000 | 0.000 | 0.000 | 0.000 | 0.923 | 0.077 | ||
| 6 spectra, EAVGNSTR | 0.000 | 0.000 | 0.000 | 0.000 | 0.000 | 0.000 | 0.943 | 0.057 | ||
| 1 spectrum, WIDETPPVDQPSR | 0.000 | 0.105 | 0.000 | 0.000 | 0.000 | 0.063 | 0.832 | 0.000 | ||
| 2 spectra, LTFDYK | 0.000 | 0.000 | 0.000 | 0.000 | 0.000 | 0.000 | 0.928 | 0.072 | ||
| 1 spectrum, YLEVMR | 0.000 | 0.000 | 0.000 | 0.000 | 0.000 | 0.000 | 0.946 | 0.054 | ||
| 1 spectrum, AECLEK | 0.162 | 0.000 | 0.000 | 0.090 | 0.000 | 0.000 | 0.745 | 0.003 | ||
| 6 spectra, FPVIQHFK | 0.000 | 0.000 | 0.000 | 0.000 | 0.000 | 0.037 | 0.958 | 0.004 | ||
| 2 spectra, VNQGLIR | 0.000 | 0.000 | 0.000 | 0.000 | 0.000 | 0.000 | 0.996 | 0.004 | ||
| 2 spectra, VDDQVAIVFK | 0.000 | 0.000 | 0.000 | 0.000 | 0.003 | 0.000 | 0.936 | 0.061 | ||
| 6 spectra, FGSLLPIHPVTSG | 0.000 | 0.000 | 0.068 | 0.000 | 0.001 | 0.000 | 0.895 | 0.036 | ||
| 4 spectra, LVALLDTLDR | 0.000 | 0.000 | 0.000 | 0.000 | 0.000 | 0.000 | 0.945 | 0.055 |
| Plot | Mito | Lyso or Perox | ER | Golgi | PM | Cytosol | Nucleus | ||||||
| Expt B |
5 peptides |
14 spectra |
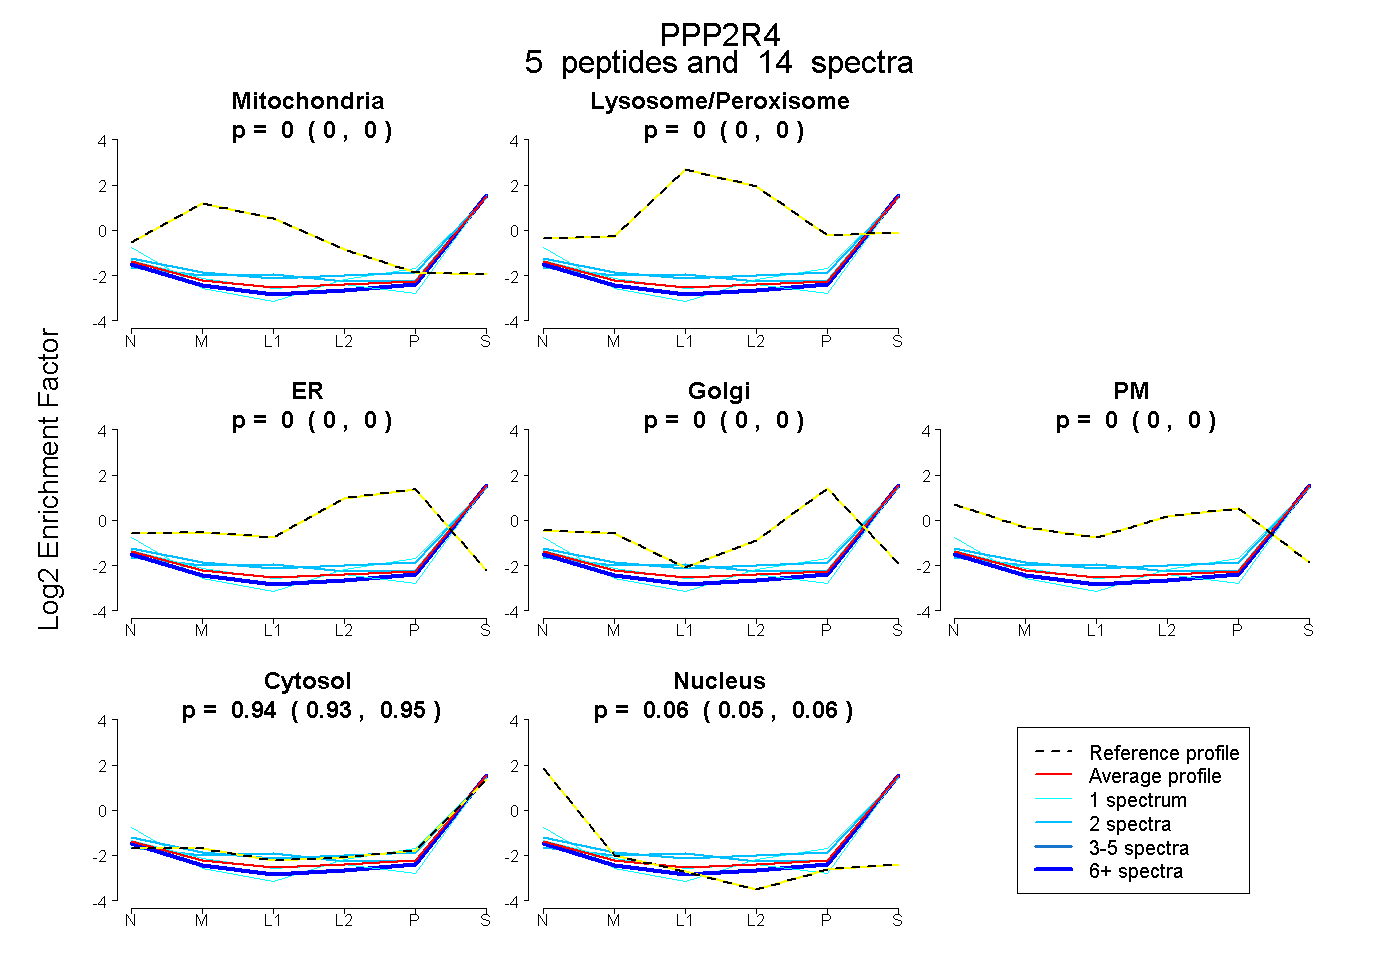 |
0.000 0.000 | 0.000 |
0.000 0.000 | 0.000 |
0.000 0.000 | 0.000 |
0.000 0.000 | 0.000 |
0.000 0.000 | 0.000 |
0.943 0.935 | 0.951 |
0.057 0.048 | 0.064 |
|||
| Plot | Lyso | Other | |||||||||||
| Expt C |
9 peptides |
33 spectra |
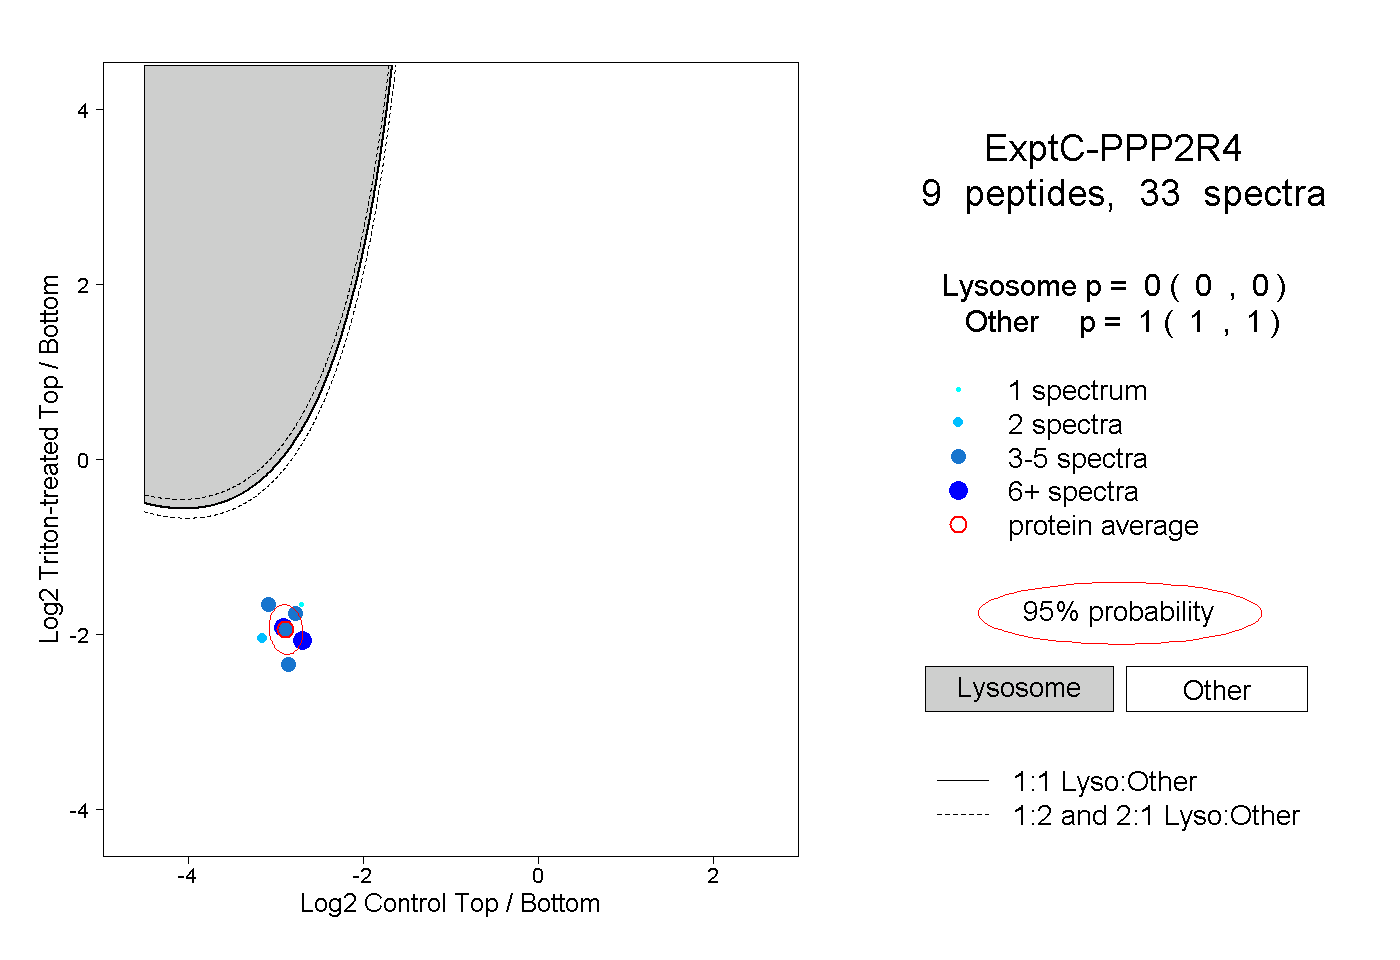 |
0.000 0.000 | 0.000 |
1.000 1.000 | 1.000 |
||||||||
| Plot | Lyso | Other | |||||||||||
| Expt D |
2 peptides |
4 spectra |
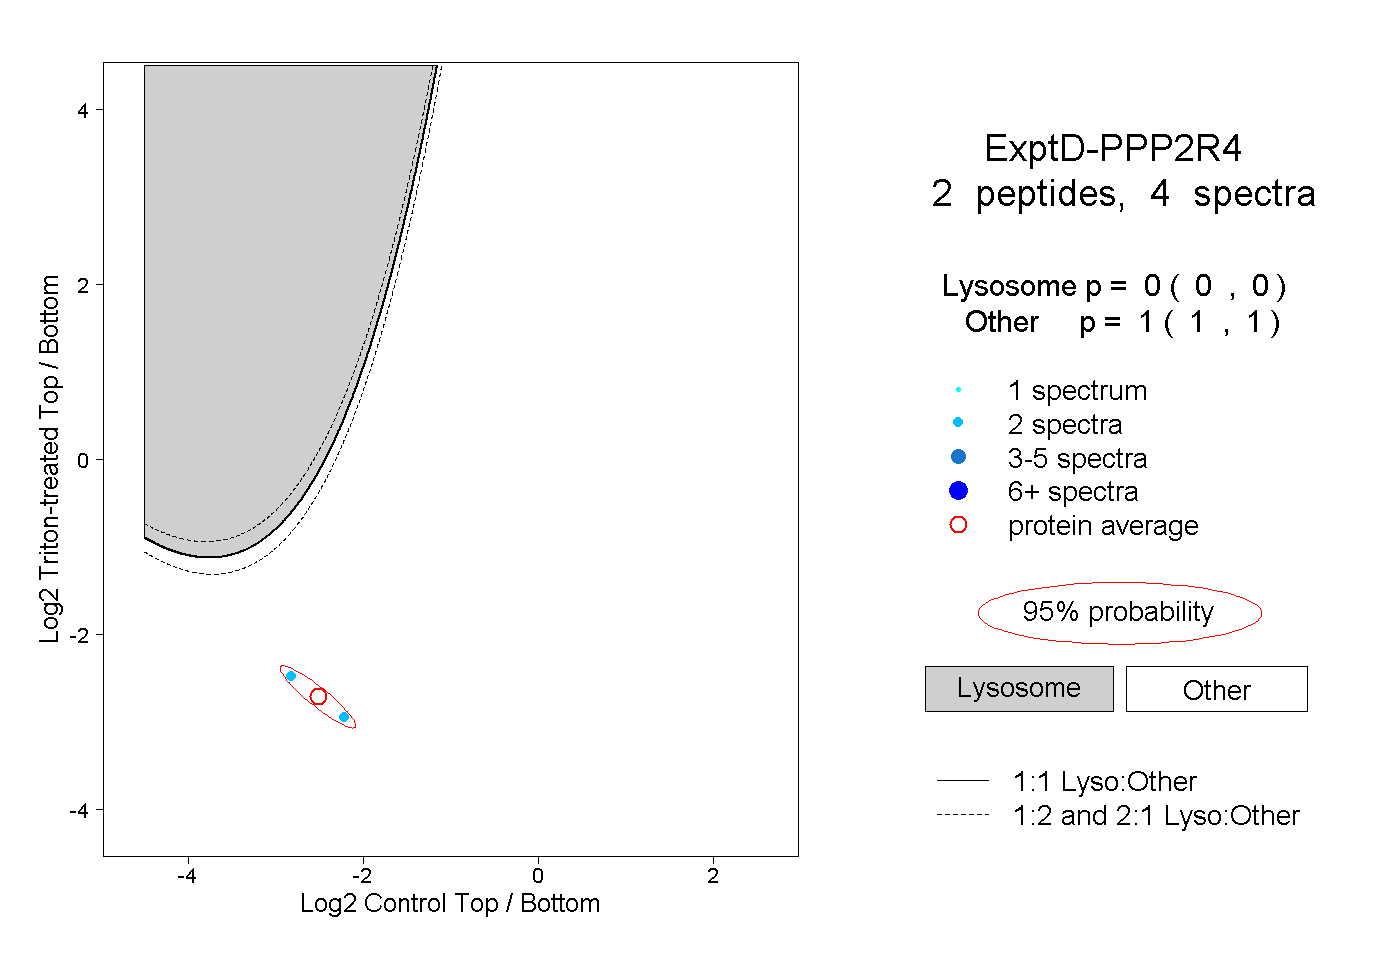 |
0.000 0.000 | 0.000 |
1.000 1.000 | 1.000 |