 8
8peptides
spectra
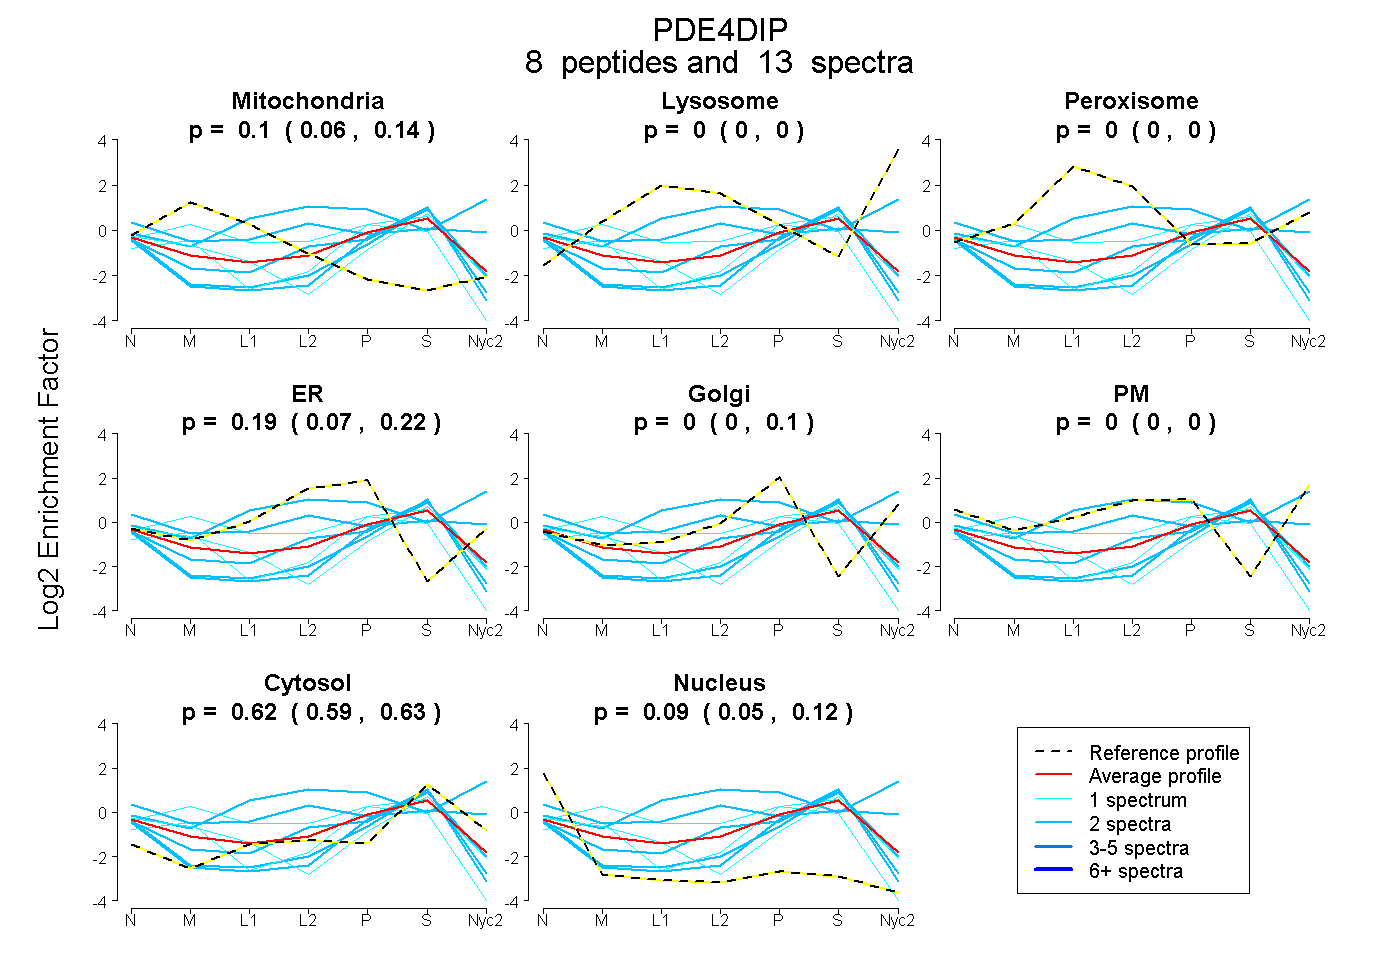
0.056 | 0.138
0.000 | 0.000
0.000 | 0.000
0.074 | 0.217
0.000 | 0.102
0.000 | 0.000
0.592 | 0.635
0.053 | 0.117
1peptide
spectra
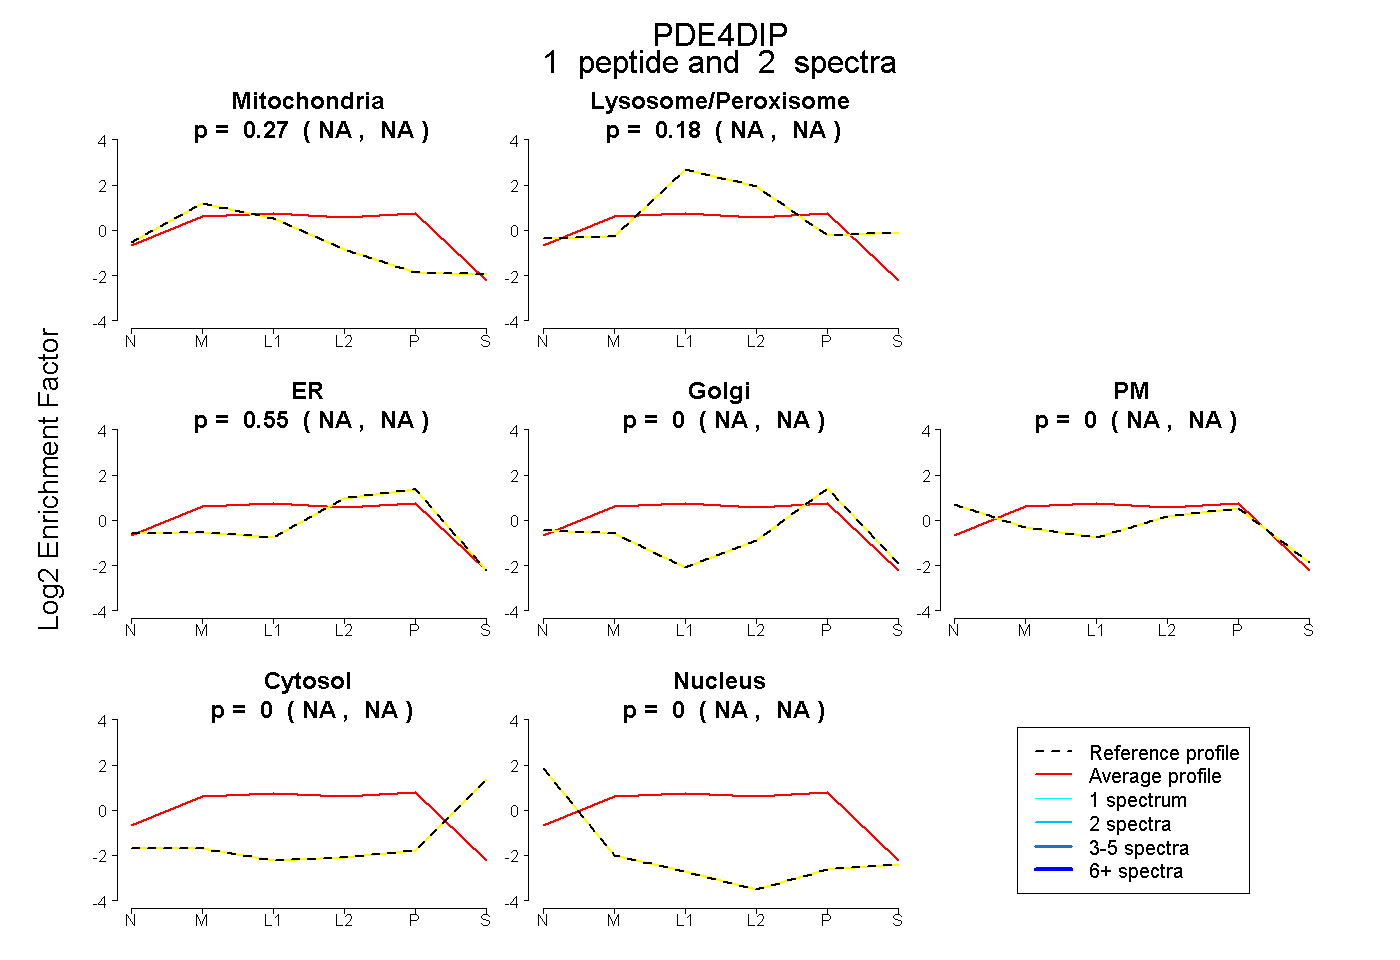
NA | NA
NA | NA
NA | NA
NA | NA
NA | NA
NA | NA
NA | NA
2peptides
spectra
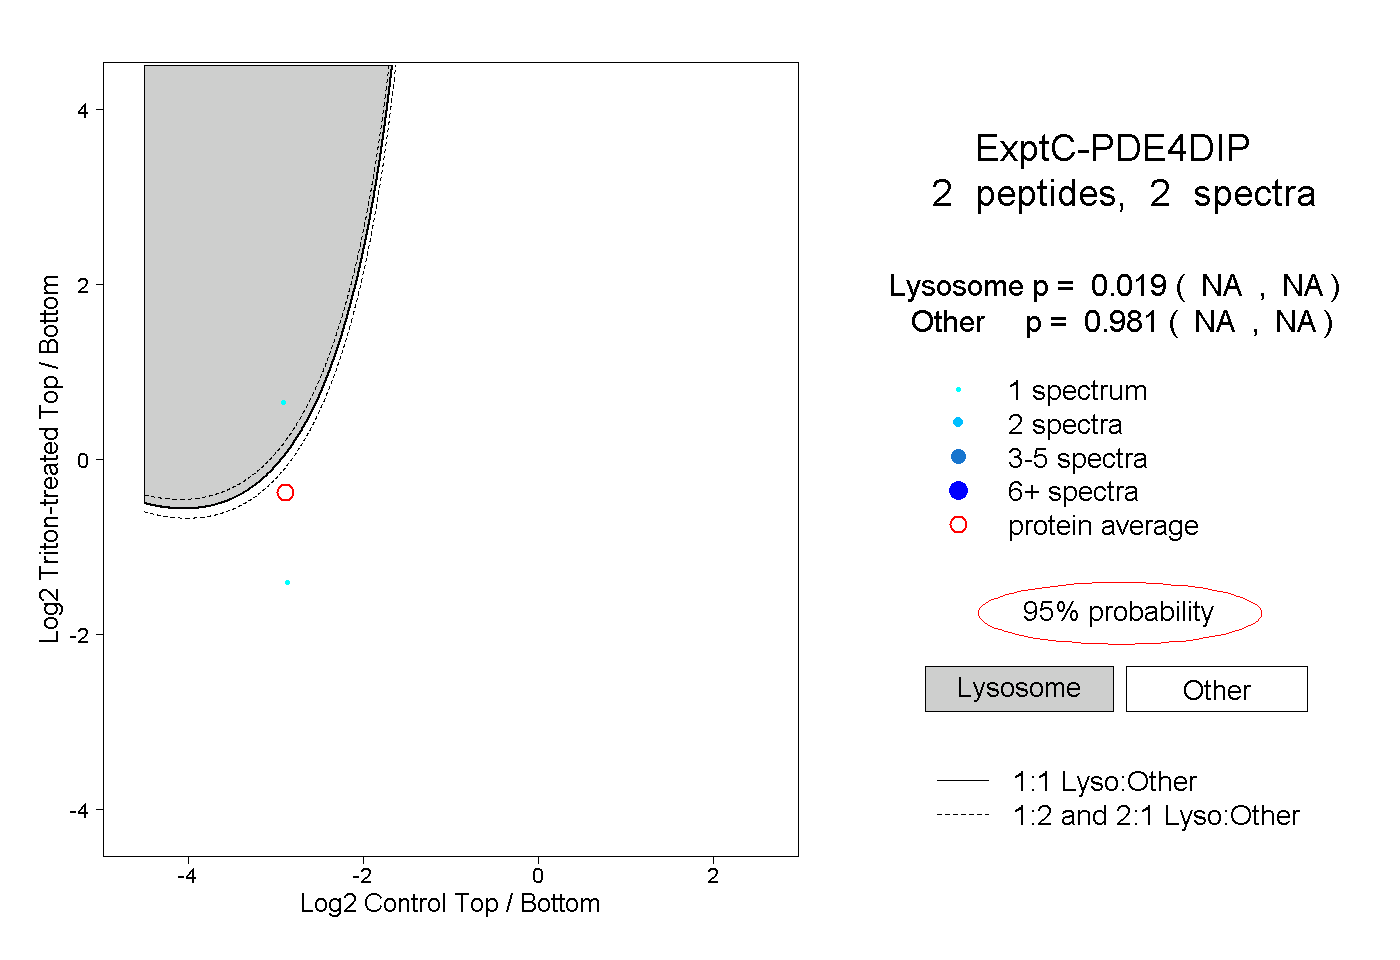
NA | NA
NA | NA