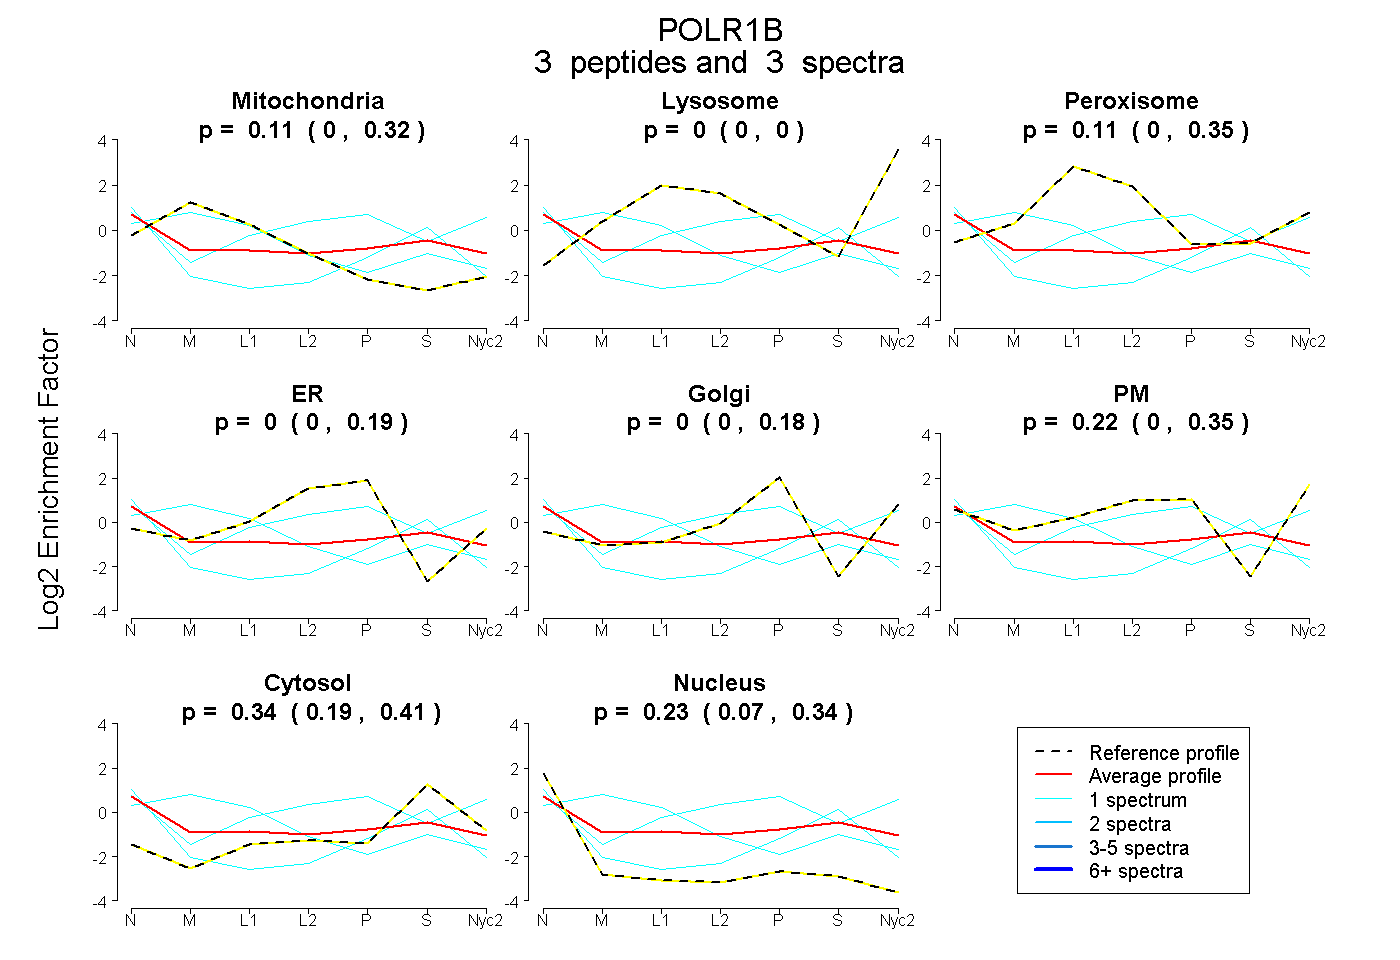
 3
3peptides
spectra
0.000 | 0.315
0.000 | 0.000
0.000 | 0.347
0.000 | 0.190
0.000 | 0.182
0.000 | 0.350
0.185 | 0.414
0.066 | 0.344
| Plot | Mito | Lyso | Perox | ER | Golgi | PM | Cytosol | Nucleus | |||||
| Expt A |
3 peptides |
3 spectra |
|
0.109 0.000 | 0.315 |
0.000 0.000 | 0.000 |
0.108 0.000 | 0.347 |
0.000 0.000 | 0.190 |
0.000 0.000 | 0.182 |
0.221 0.000 | 0.350 |
0.336 0.185 | 0.414 |
0.227 0.066 | 0.344 |