TALDO1
[ENSRNOP00000024863]
Main page
| | | Plot |
Mito |
Lyso |
|
Perox |
ER |
Golgi |
PM |
Cytosol |
Nucleus |
|
| Expt A |
 21
21
peptides |
92
spectra |
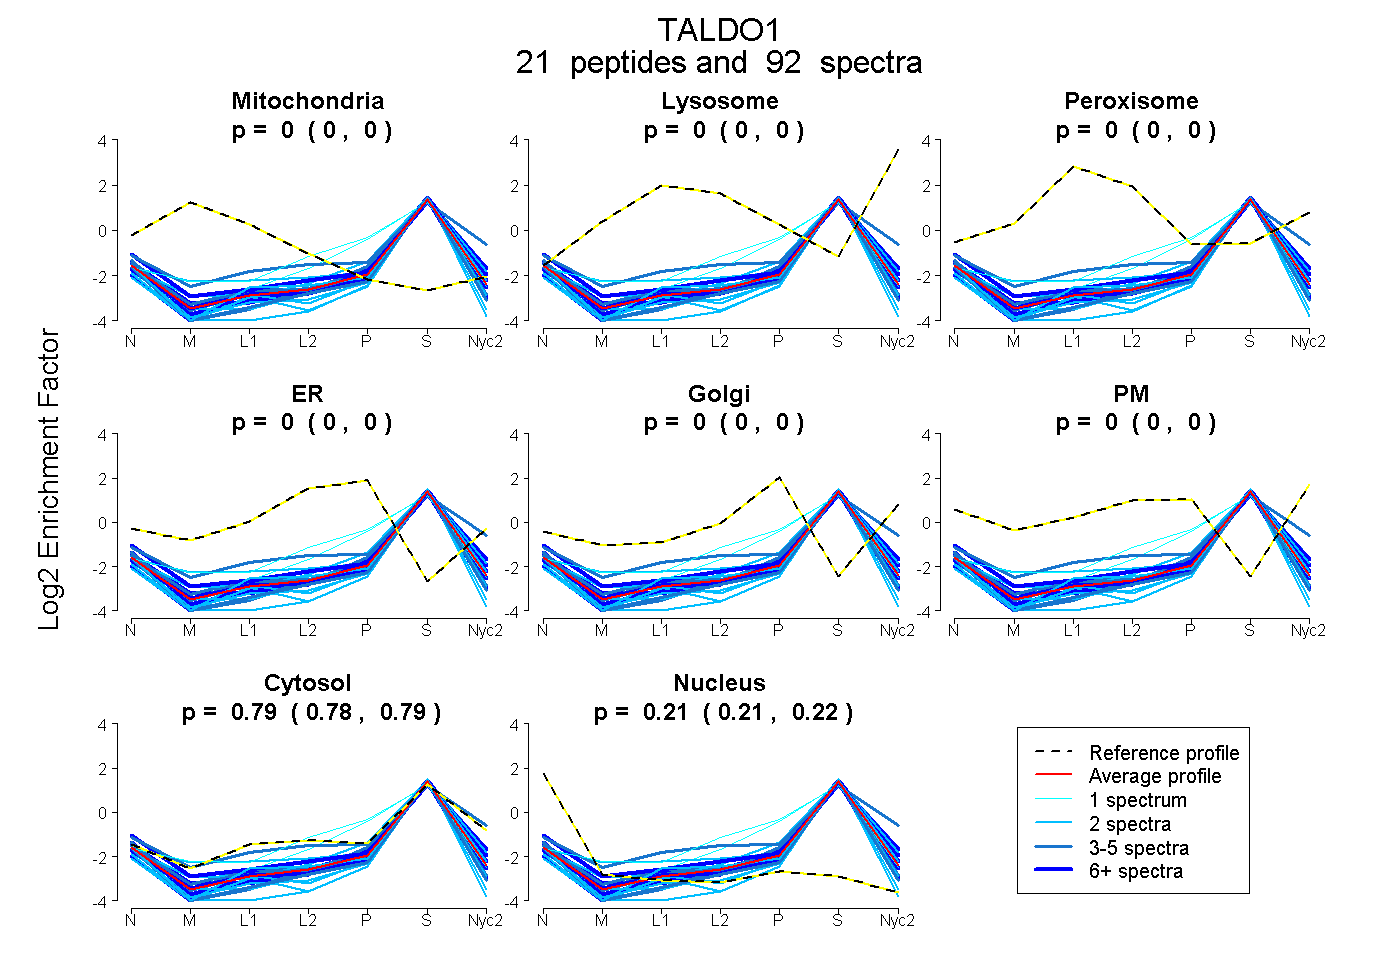 |
0.000
0.000 | 0.000 |
0.000
0.000 | 0.000 |
|
0.000
0.000 | 0.000 |
0.000
0.000 | 0.000 |
0.000
0.000 | 0.000 |
0.000
0.000 | 0.000 |
0.787
0.785 | 0.789 |
0.213
0.210 | 0.215 |
|
| | | Plot |
Mito |
|
Lyso or Perox |
|
ER |
Golgi |
PM |
Cytosol |
Nucleus |
|
| Expt B |
6
peptides |
32
spectra |
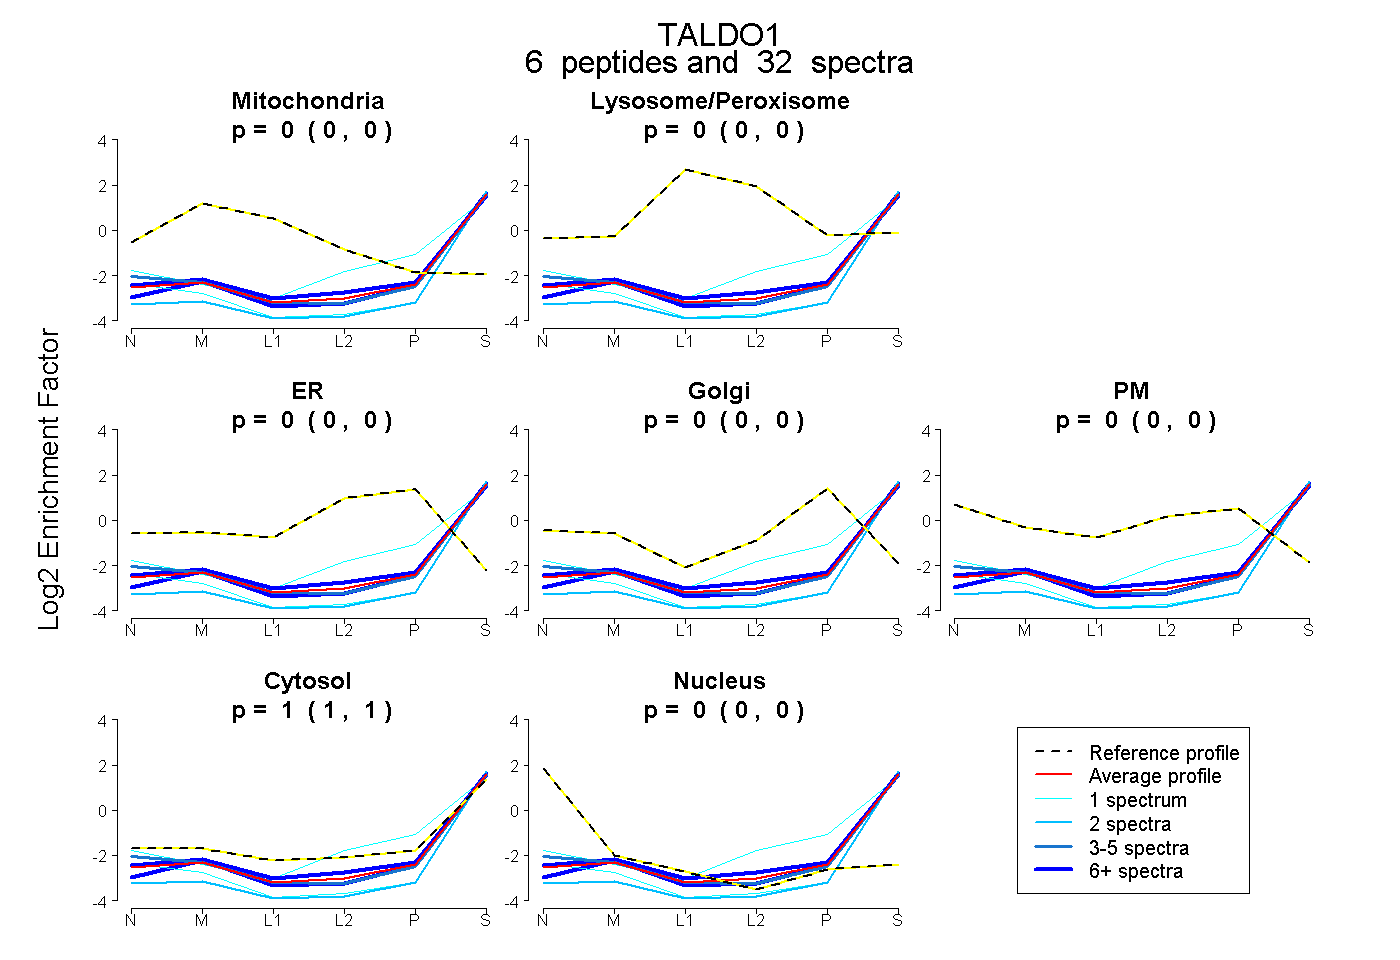 |
0.000
0.000 | 0.000 |
|
0.000
0.000 | 0.000 |
|
0.000
0.000 | 0.000 |
0.000
0.000 | 0.000 |
0.000
0.000 | 0.000 |
1.000
1.000 | 1.000 |
0.000
0.000 | 0.000 |
|
| 17 spectra, TIVMGASFR |
0.000 |
|
0.000 |
|
0.000 |
0.000 |
0.000 |
1.000 |
0.000 |
|
| 1 spectrum, LGGPQEEQIK |
0.000 |
|
0.000 |
|
0.000 |
0.000 |
0.000 |
0.960 |
0.040 |
|
| 2 spectra, MESALDQLK |
0.000 |
|
0.000 |
|
0.000 |
0.000 |
0.000 |
1.000 |
0.000 |
|
| 5 spectra, VSTEVDAR |
0.000 |
|
0.000 |
|
0.000 |
0.000 |
0.000 |
0.973 |
0.027 |
|
| 6 spectra, IHLDEK |
0.000 |
|
0.000 |
|
0.000 |
0.000 |
0.000 |
1.000 |
0.000 |
|
| 1 spectrum, SYEPQEDPGVK |
0.000 |
|
0.000 |
|
0.000 |
0.051 |
0.000 |
0.949 |
0.000 |
|
| | | Plot |
|
Lyso |
|
|
|
|
|
|
|
Other |
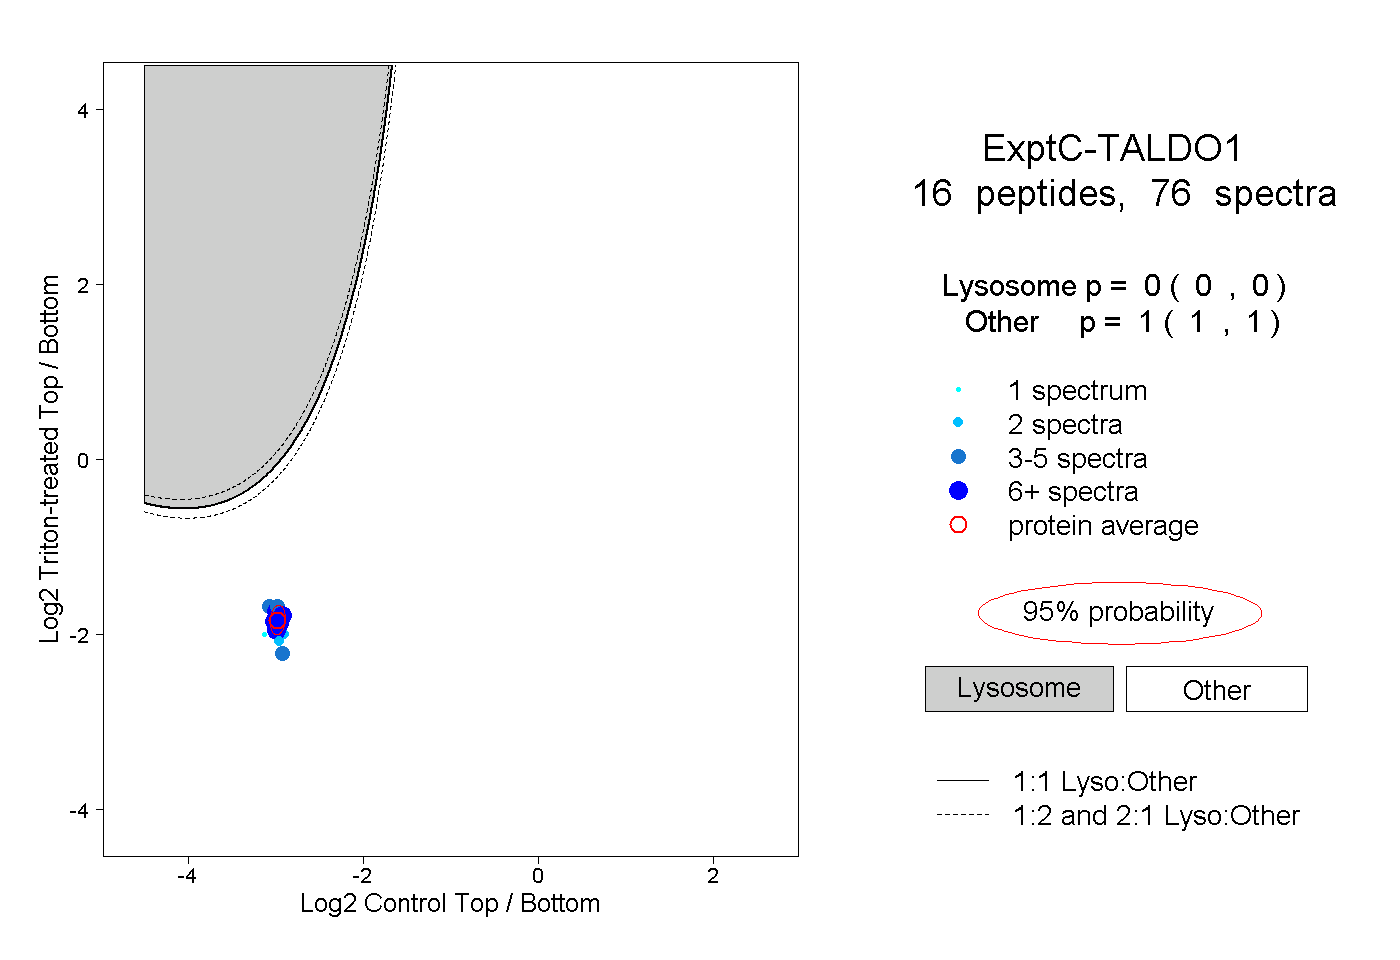
| Expt C |
16
peptides |
76
spectra |
 |
|
0.000
0.000 | 0.000 |
|
|
|
|
|
|
|
1.000
1.000 | 1.000 |
| | | Plot |
|
Lyso |
|
|
|
|
|
|
|
Other |
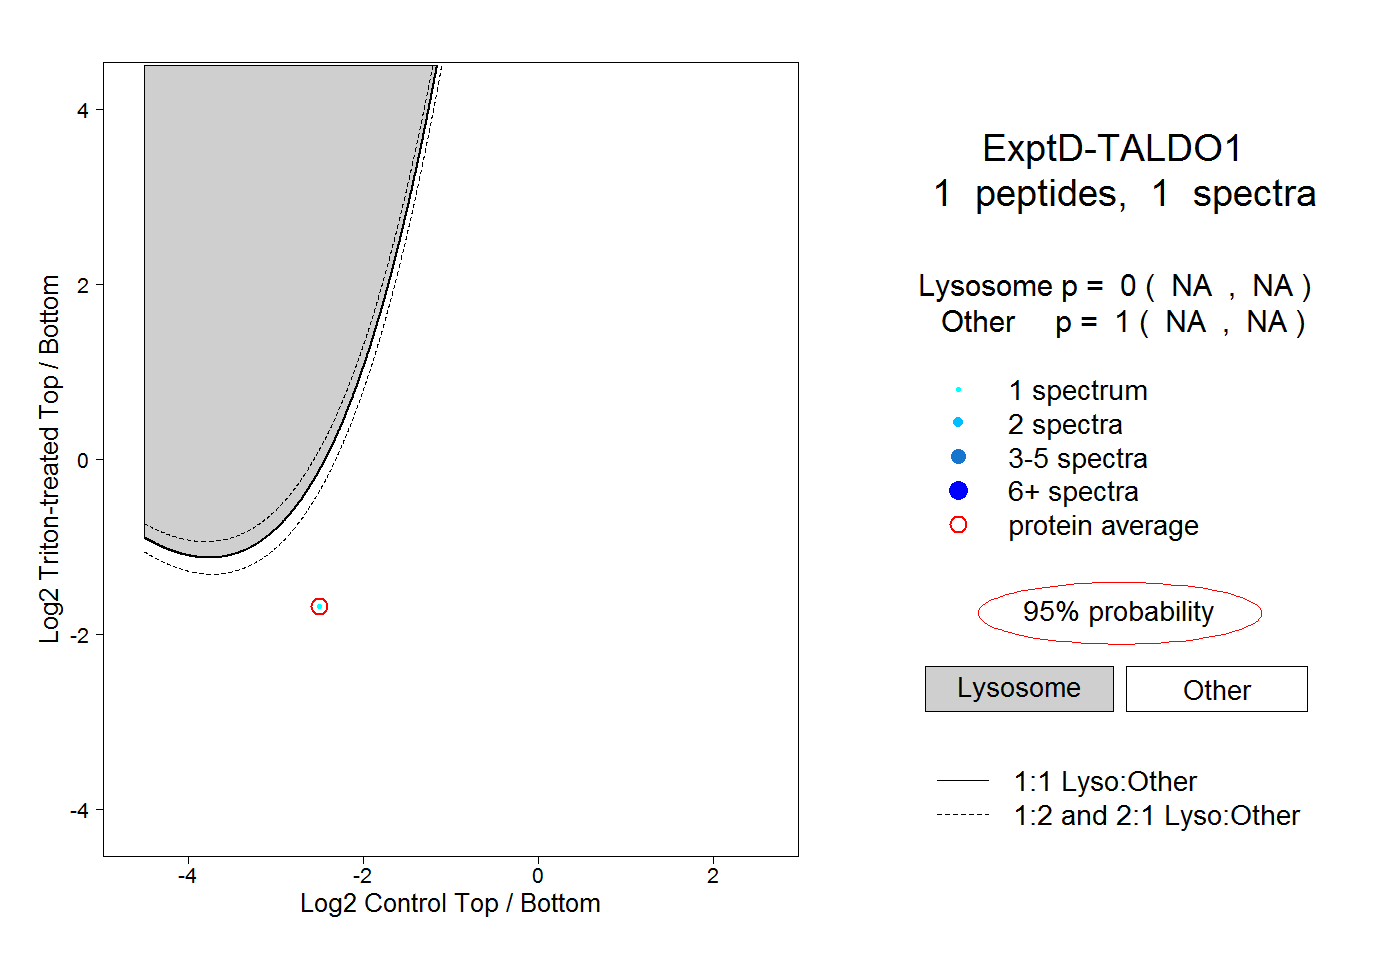
| Expt D |
1
peptide |
1
spectrum |
 |
|
0.000
NA | NA |
|
|
|
|
|
|
|
1.000
NA | NA |