 21
21peptides
spectra
0.000 | 0.000
0.000 | 0.000
0.000 | 0.000
0.000 | 0.000
0.000 | 0.000
0.000 | 0.000
0.785 | 0.789
0.210 | 0.215
| Plot | Mito | Lyso | Perox | ER | Golgi | PM | Cytosol | Nucleus | |||||
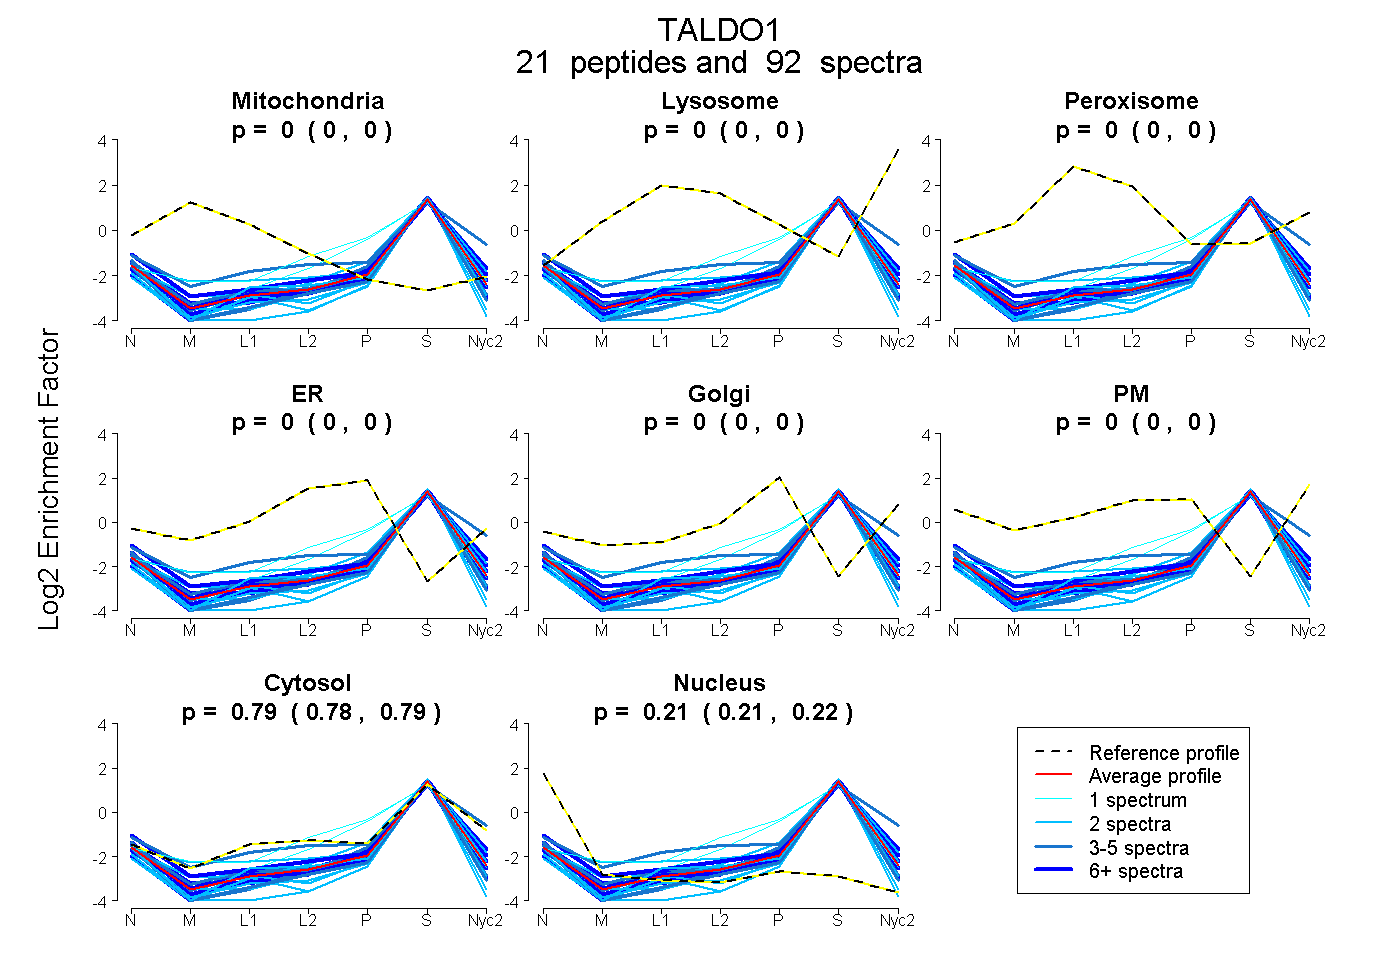
| Expt A |
21 peptides |
92 spectra |
|
0.000 0.000 | 0.000 |
0.000 0.000 | 0.000 |
0.000 0.000 | 0.000 |
0.000 0.000 | 0.000 |
0.000 0.000 | 0.000 |
0.000 0.000 | 0.000 |
0.787 0.785 | 0.789 |
0.213 0.210 | 0.215 |
| 16 spectra, TIVMGASFR | 0.000 | 0.000 | 0.000 | 0.000 | 0.000 | 0.000 | 0.801 | 0.199 | ||
| 4 spectra, VSTEVDAR | 0.000 | 0.000 | 0.000 | 0.000 | 0.000 | 0.000 | 0.711 | 0.289 | ||
| 1 spectrum, SYEPQEDPGVK | 0.000 | 0.000 | 0.000 | 0.043 | 0.000 | 0.000 | 0.882 | 0.076 | ||
| 1 spectrum, EAGISK | 0.000 | 0.000 | 0.000 | 0.000 | 0.000 | 0.000 | 0.856 | 0.144 | ||
| 3 spectra, LGGPQEEQIK | 0.000 | 0.000 | 0.000 | 0.000 | 0.000 | 0.000 | 0.787 | 0.213 | ||
| 2 spectra, LAPTLSVK | 0.000 | 0.000 | 0.000 | 0.000 | 0.000 | 0.000 | 0.764 | 0.236 | ||
| 7 spectra, DAMVAR | 0.000 | 0.000 | 0.000 | 0.000 | 0.000 | 0.000 | 0.862 | 0.138 | ||
| 2 spectra, ILDWHVANTDK | 0.000 | 0.000 | 0.000 | 0.000 | 0.000 | 0.000 | 0.854 | 0.146 | ||
| 2 spectra, FAADAIK | 0.000 | 0.000 | 0.000 | 0.000 | 0.000 | 0.000 | 0.690 | 0.310 | ||
| 4 spectra, IIELYK | 0.000 | 0.000 | 0.000 | 0.000 | 0.000 | 0.000 | 0.799 | 0.201 | ||
| 12 spectra, MESALDQLK | 0.000 | 0.000 | 0.000 | 0.000 | 0.000 | 0.000 | 0.818 | 0.182 | ||
| 8 spectra, IHLDEK | 0.000 | 0.000 | 0.000 | 0.000 | 0.000 | 0.000 | 0.723 | 0.277 | ||
| 2 spectra, WLHNEDQMAVEK | 0.000 | 0.000 | 0.000 | 0.000 | 0.000 | 0.000 | 0.818 | 0.182 | ||
| 3 spectra, NTGEIK | 0.000 | 0.000 | 0.000 | 0.000 | 0.000 | 0.000 | 0.965 | 0.035 | ||
| 2 spectra, IYNYYK | 0.000 | 0.000 | 0.000 | 0.000 | 0.000 | 0.000 | 0.770 | 0.230 | ||
| 5 spectra, LLGELLK | 0.000 | 0.000 | 0.000 | 0.000 | 0.000 | 0.000 | 0.725 | 0.275 | ||
| 2 spectra, ALAGCDFLTISPK | 0.000 | 0.000 | 0.000 | 0.000 | 0.000 | 0.000 | 0.680 | 0.320 | ||
| 9 spectra, AAQTSDLEK | 0.000 | 0.000 | 0.000 | 0.000 | 0.000 | 0.000 | 0.748 | 0.252 | ||
| 3 spectra, LSDGIR | 0.000 | 0.000 | 0.000 | 0.000 | 0.000 | 0.000 | 0.833 | 0.167 | ||
| 2 spectra, MFSAENGK | 0.000 | 0.000 | 0.000 | 0.000 | 0.000 | 0.000 | 0.809 | 0.191 | ||
| 2 spectra, LSSTWEGIQAGK | 0.000 | 0.000 | 0.000 | 0.000 | 0.000 | 0.000 | 0.722 | 0.278 |
| Plot | Mito | Lyso or Perox | ER | Golgi | PM | Cytosol | Nucleus | ||||||
| Expt B |
6 peptides |
32 spectra |
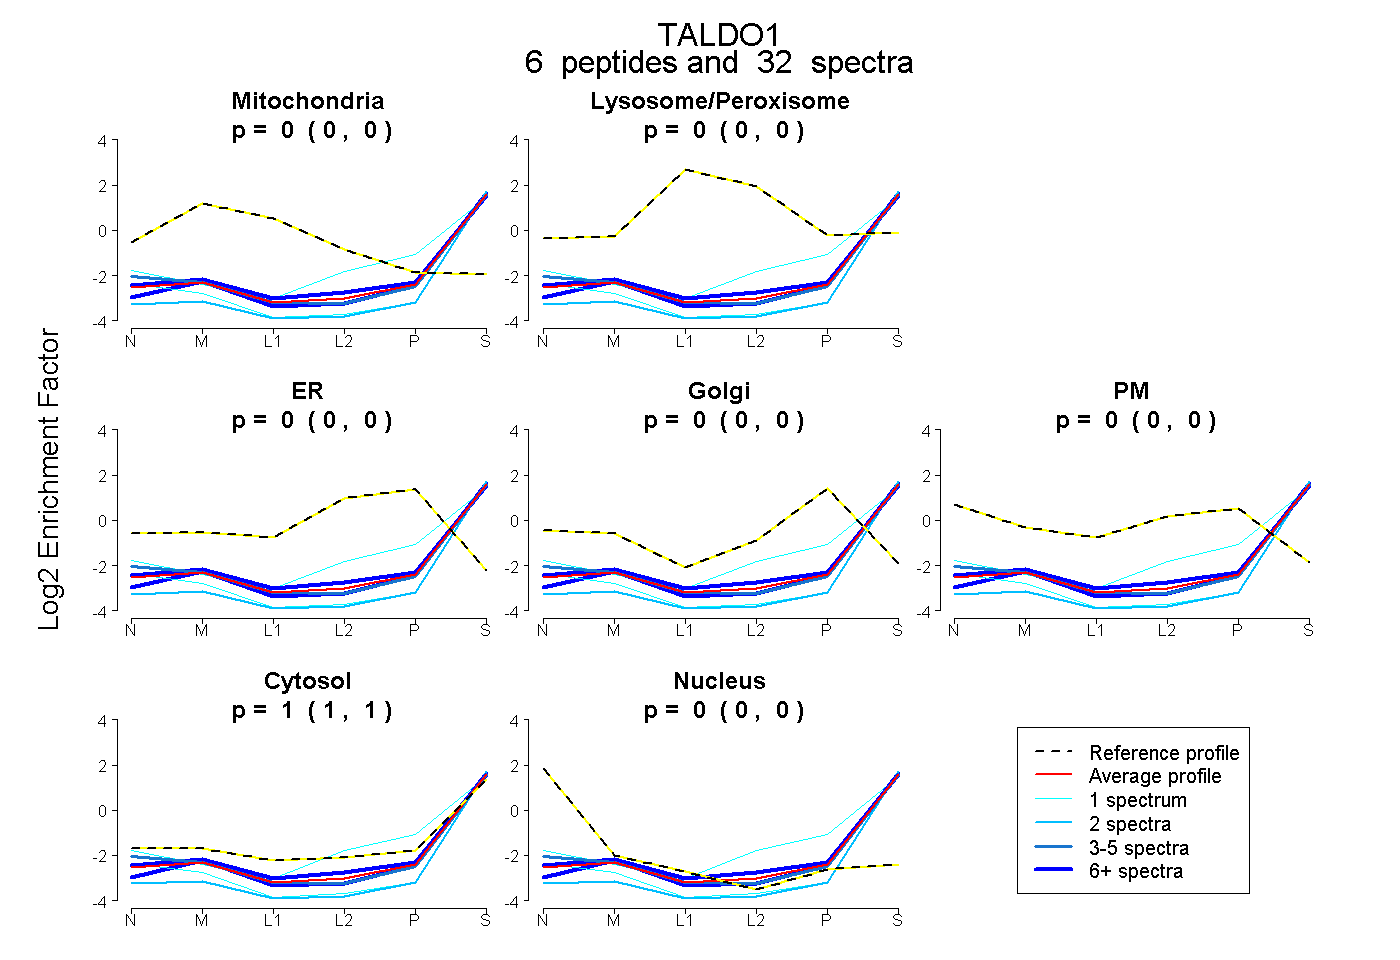 |
0.000 0.000 | 0.000 |
0.000 0.000 | 0.000 |
0.000 0.000 | 0.000 |
0.000 0.000 | 0.000 |
0.000 0.000 | 0.000 |
1.000 1.000 | 1.000 |
0.000 0.000 | 0.000 |
|||
| Plot | Lyso | Other | |||||||||||
| Expt C |
16 peptides |
76 spectra |
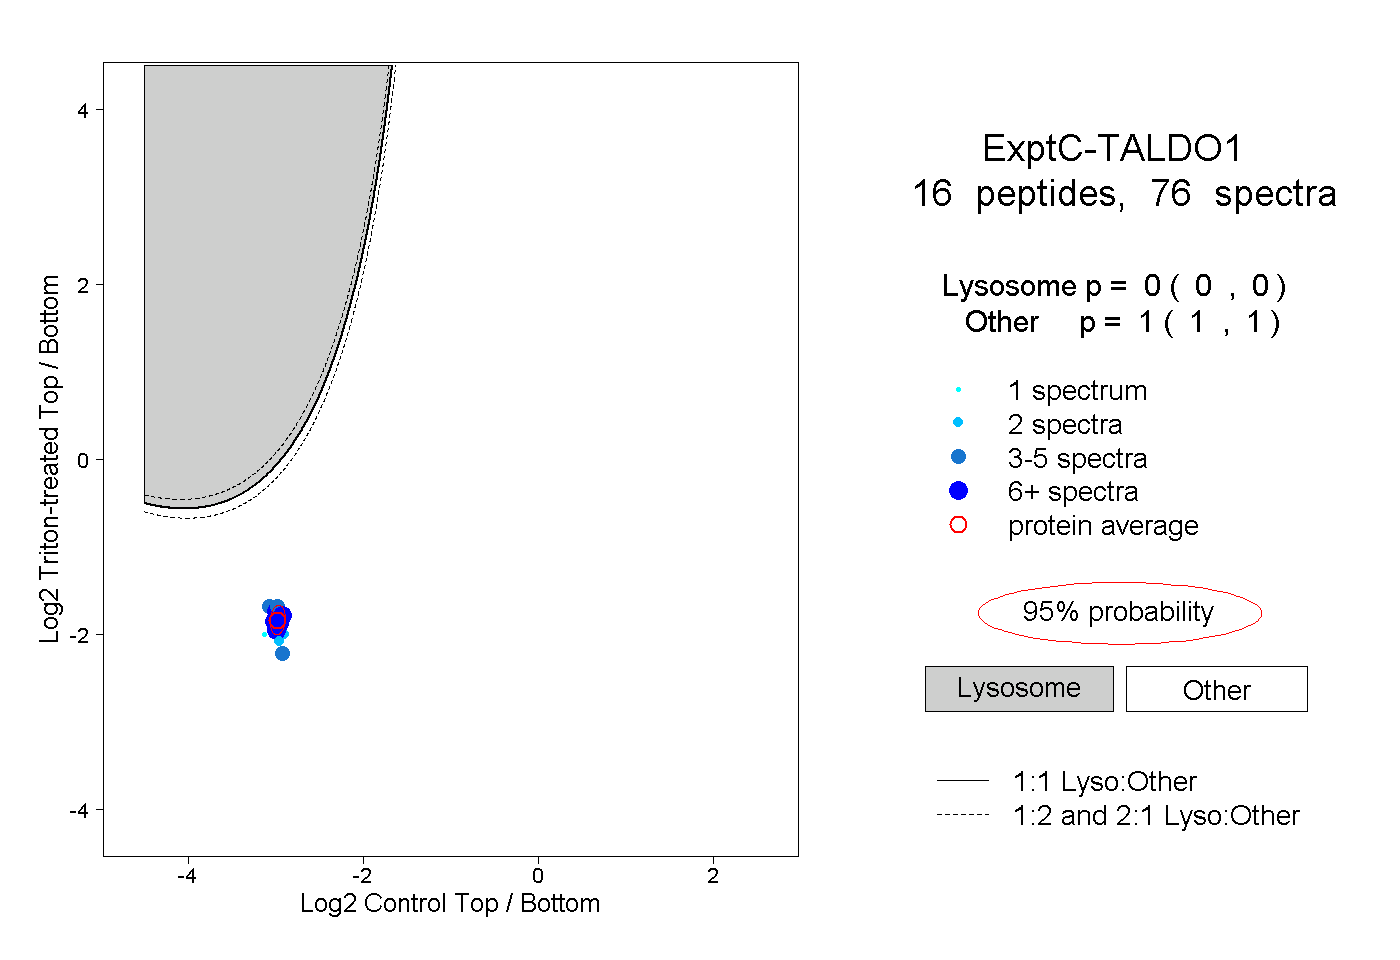 |
0.000 0.000 | 0.000 |
1.000 1.000 | 1.000 |
||||||||
| Plot | Lyso | Other | |||||||||||
| Expt D |
1 peptide |
1 spectrum |
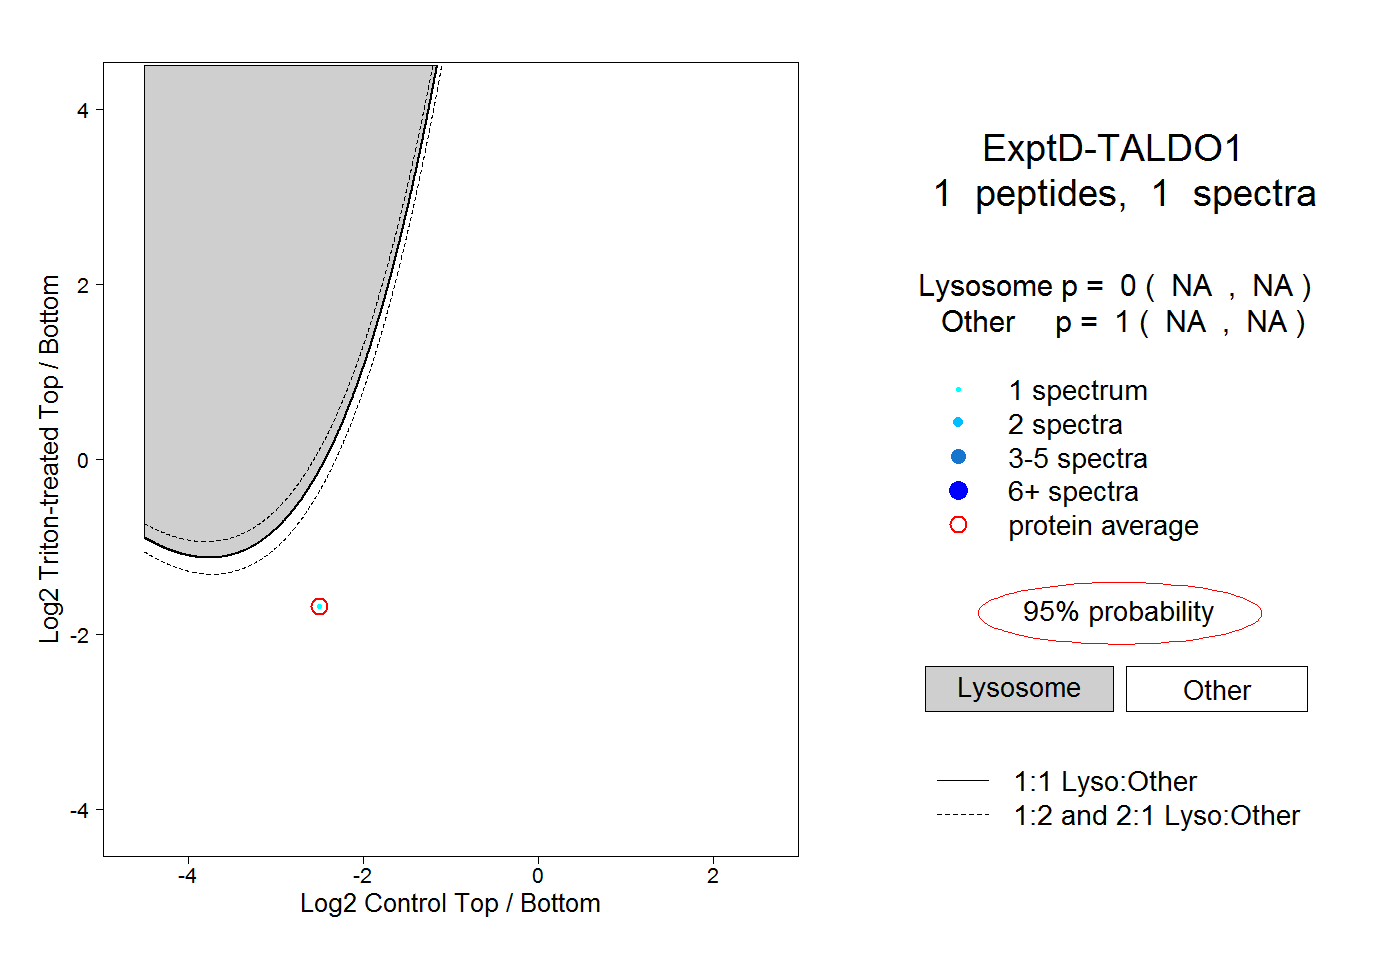 |
0.000 NA | NA |
1.000 NA | NA |