 2
2peptides
spectra
0.000 | 0.000
0.500 | 0.516
0.000 | 0.000
0.122 | 0.156
0.059 | 0.097
0.000 | 0.000
0.262 | 0.278
0.000 | 0.000
5peptides
spectra
0.000 | 0.000
1.000 | 1.000
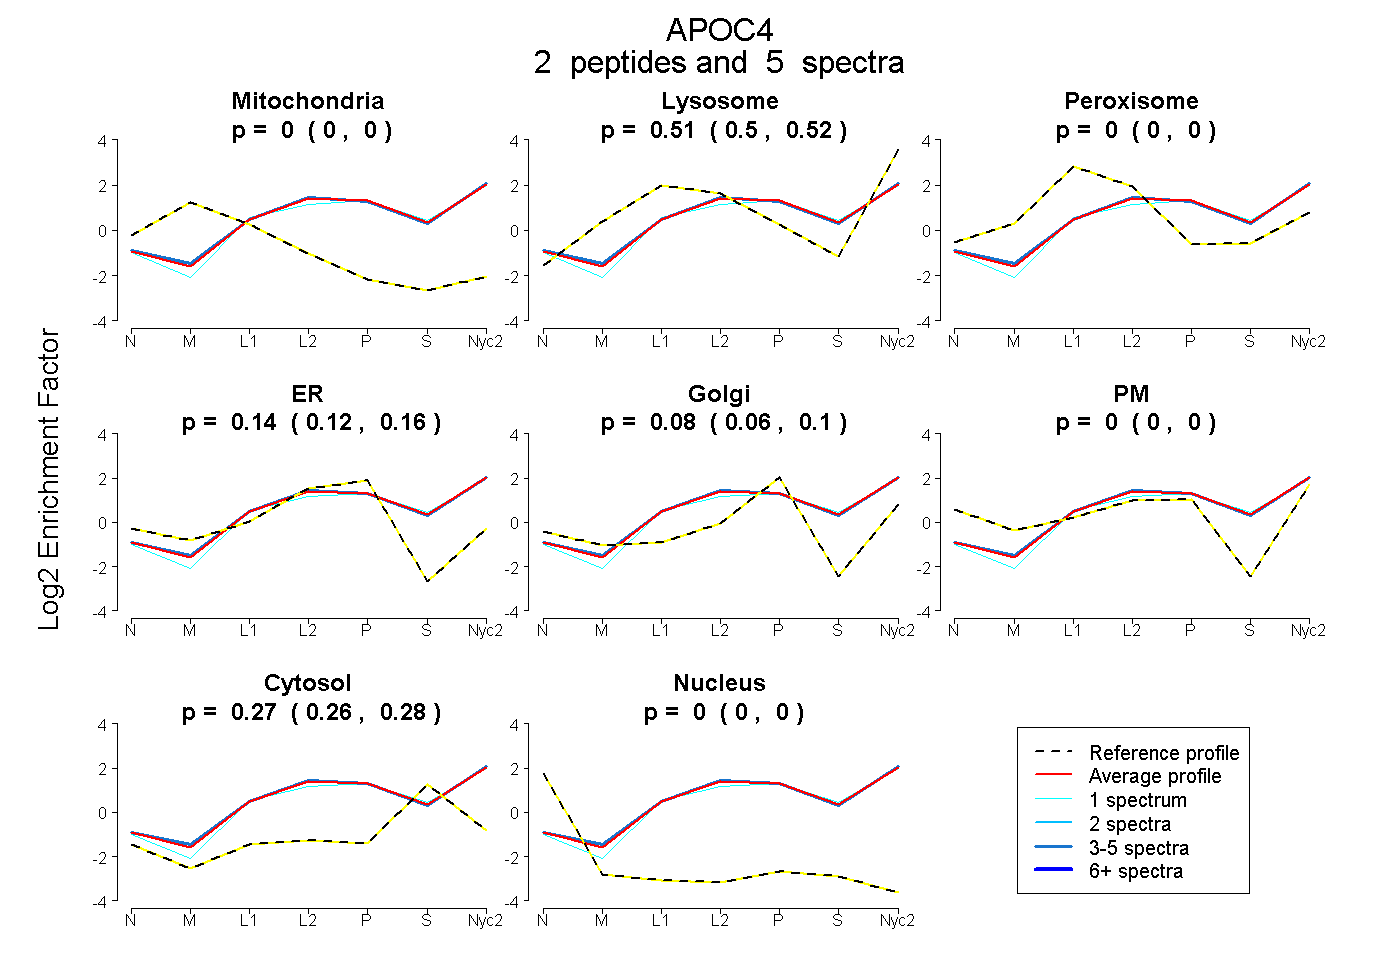
| Plot | Mito | Lyso | Perox | ER | Golgi | PM | Cytosol | Nucleus | |||||
| Expt A |
2 peptides |
5 spectra |
|
0.000 0.000 | 0.000 |
0.509 0.500 | 0.516 |
0.000 0.000 | 0.000 |
0.141 0.122 | 0.156 |
0.080 0.059 | 0.097 |
0.000 0.000 | 0.000 |
0.270 0.262 | 0.278 |
0.000 0.000 | 0.000 |
||
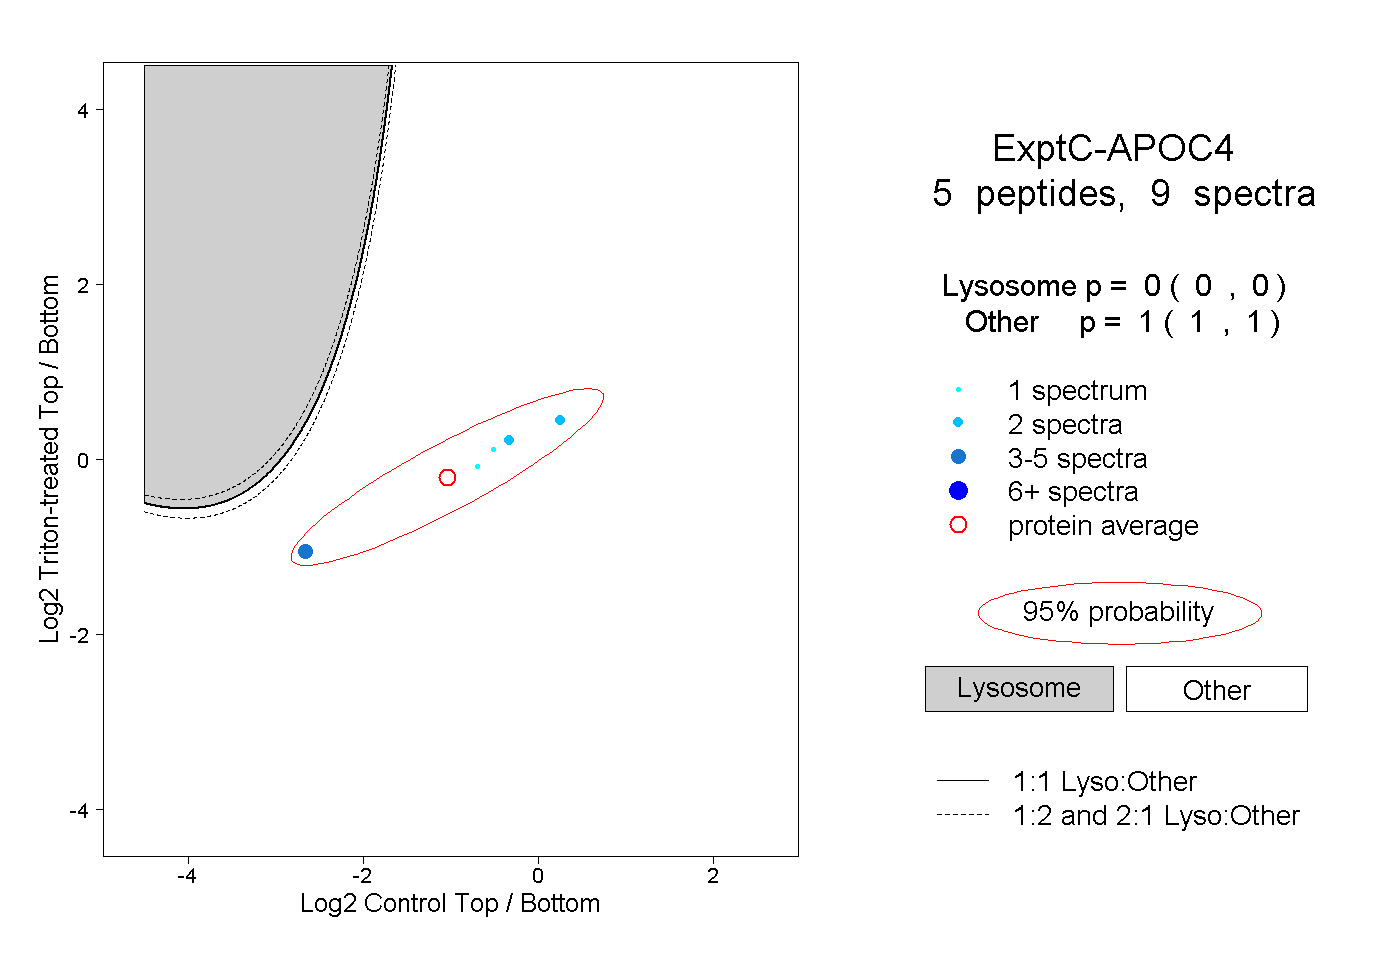
| Plot | Lyso | Other | |||||||||||
| Expt C |
5 peptides |
9 spectra |
|
0.000 0.000 | 0.000 |
1.000 1.000 | 1.000 |