 12
12peptides
spectra
0.000 | 0.000
0.000 | 0.000
0.000 | 0.000
0.142 | 0.224
0.189 | 0.287
0.000 | 0.001
0.513 | 0.531
0.033 | 0.058
5peptides
spectra
0.000 | 0.000
1.000 | 1.000
| Plot | Mito | Lyso | Perox | ER | Golgi | PM | Cytosol | Nucleus | |||||
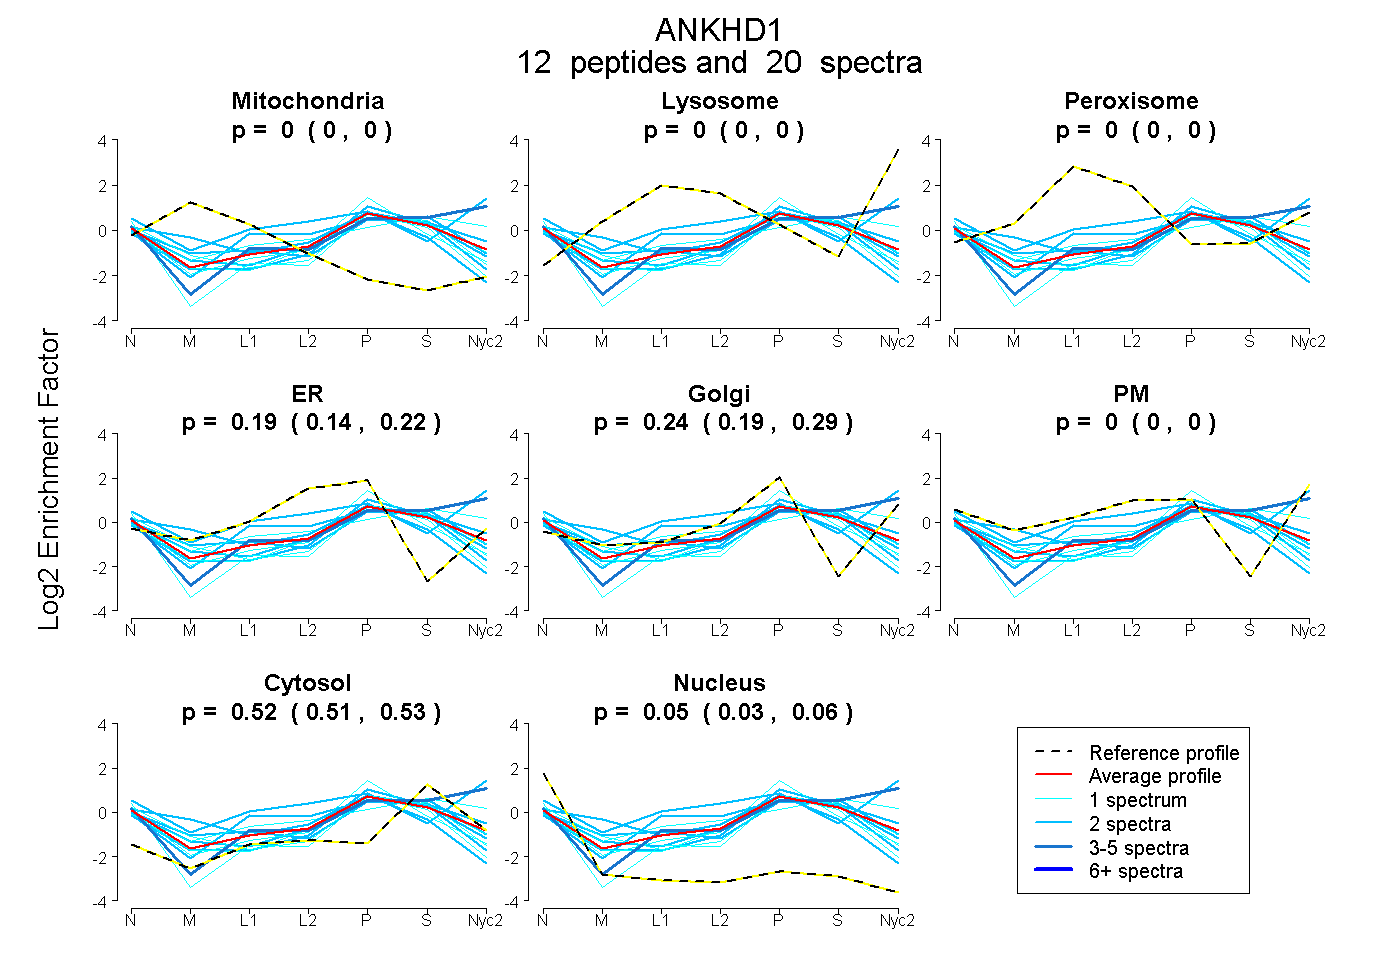
| Expt A |
12 peptides |
20 spectra |
|
0.000 0.000 | 0.000 |
0.000 0.000 | 0.000 |
0.000 0.000 | 0.000 |
0.190 0.142 | 0.224 |
0.241 0.189 | 0.287 |
0.000 0.000 | 0.001 |
0.522 0.513 | 0.531 |
0.047 0.033 | 0.058 |
||
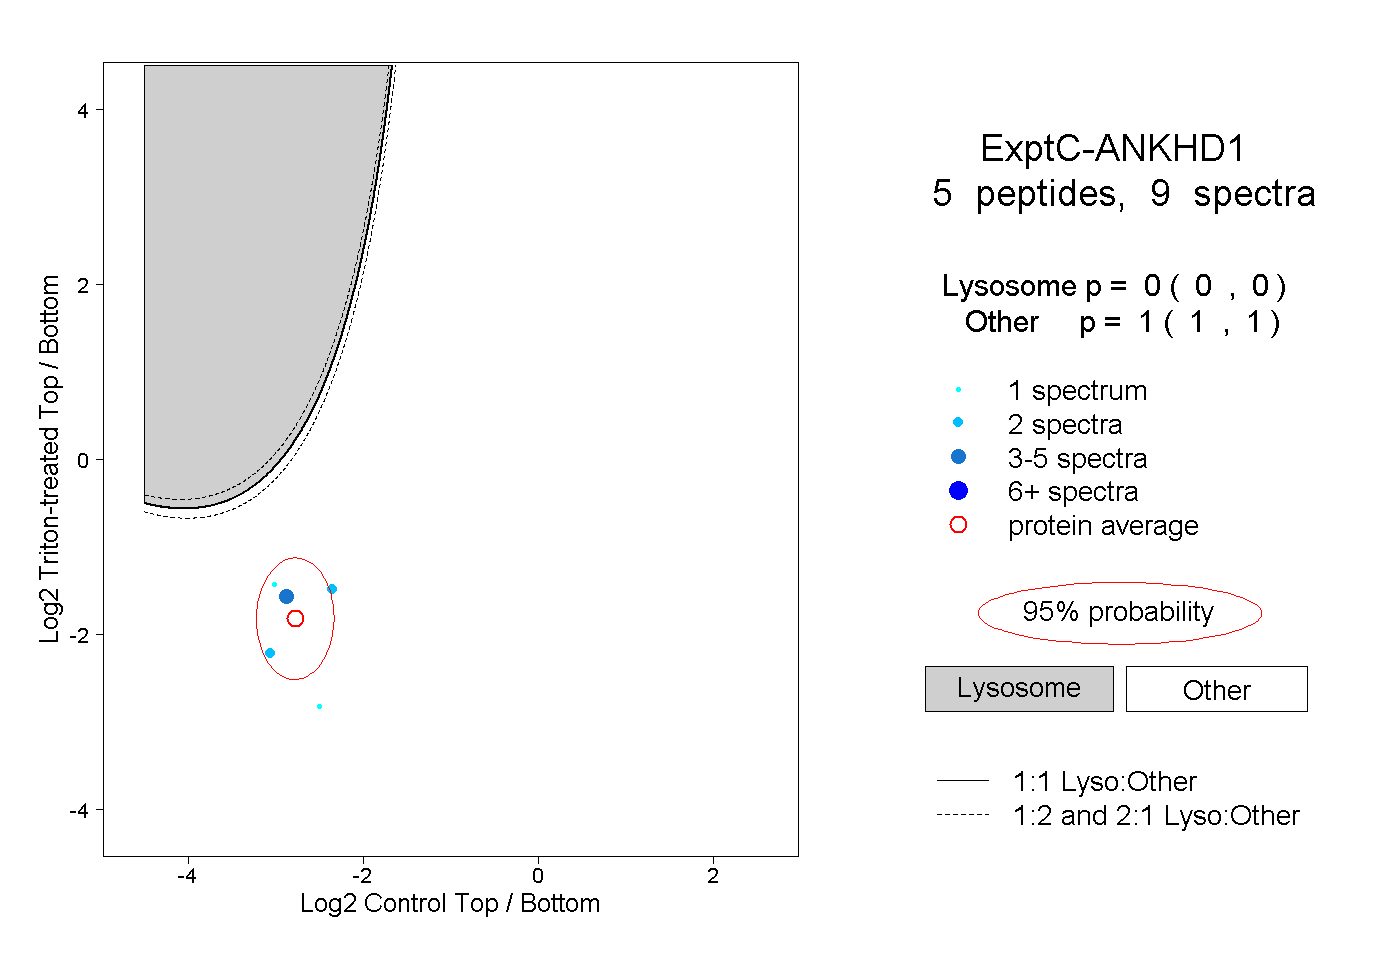
| Plot | Lyso | Other | |||||||||||
| Expt C |
5 peptides |
9 spectra |
|
0.000 0.000 | 0.000 |
1.000 1.000 | 1.000 |