APOC2
[ENSRNOP00000024800]
Main page
| | | Plot |
Mito |
Lyso |
|
Perox |
ER |
Golgi |
PM |
Cytosol |
Nucleus |
|
| Expt A |
 1
1
peptide |
2
spectra |
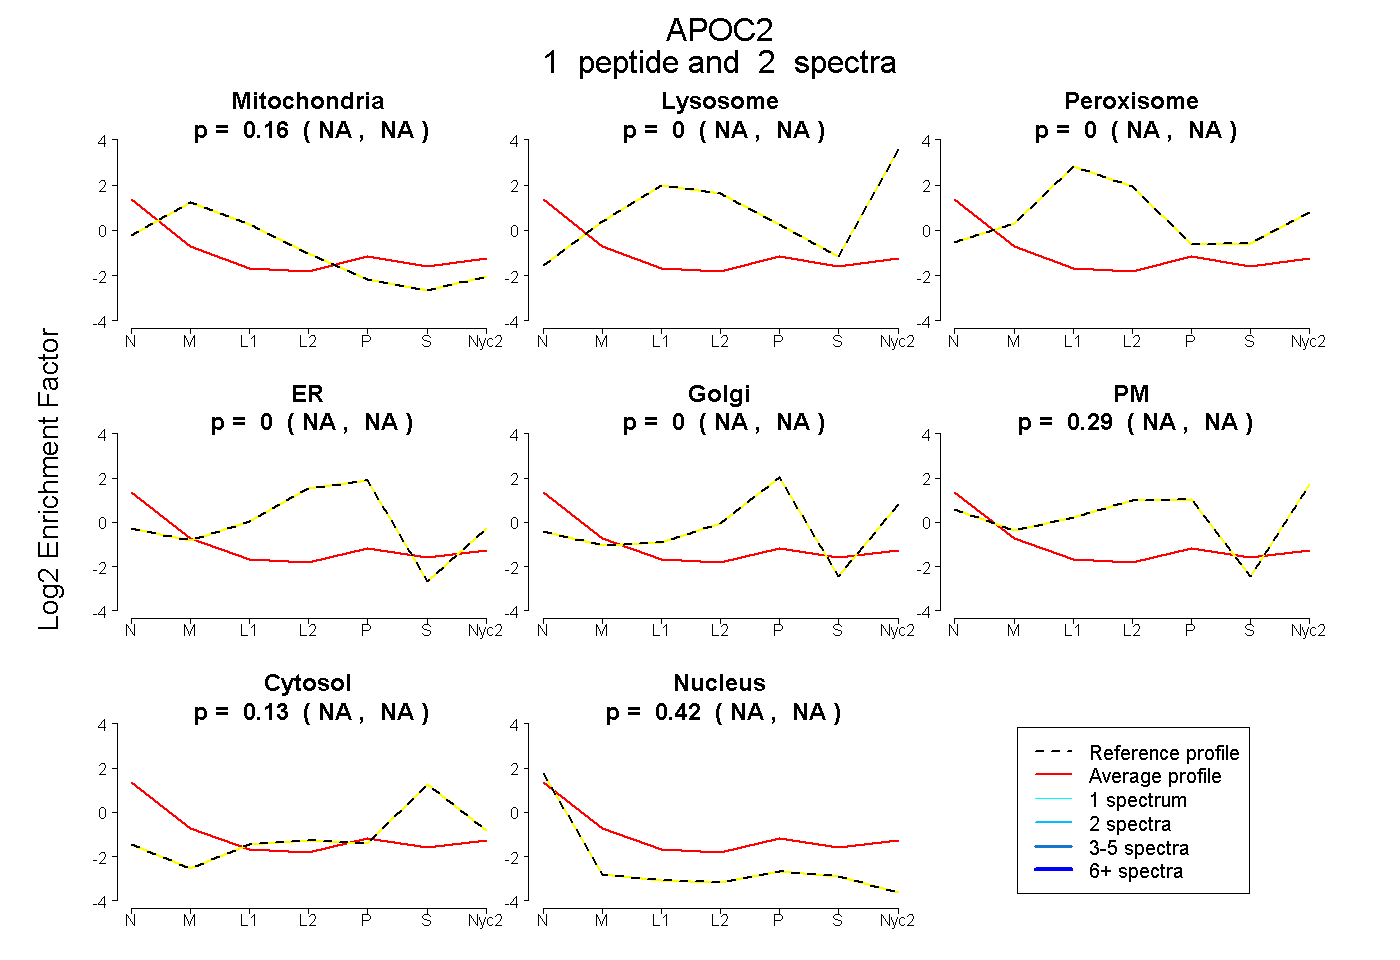 |
0.159
NA | NA |
0.000
NA | NA |
|
0.000
NA | NA |
0.000
NA | NA |
0.000
NA | NA |
0.292
NA | NA |
0.129
NA | NA |
0.421
NA | NA |
|
| | | Plot |
Mito |
|
Lyso or Perox |
|
ER |
Golgi |
PM |
Cytosol |
Nucleus |
|
| Expt B |
2
peptides |
3
spectra |
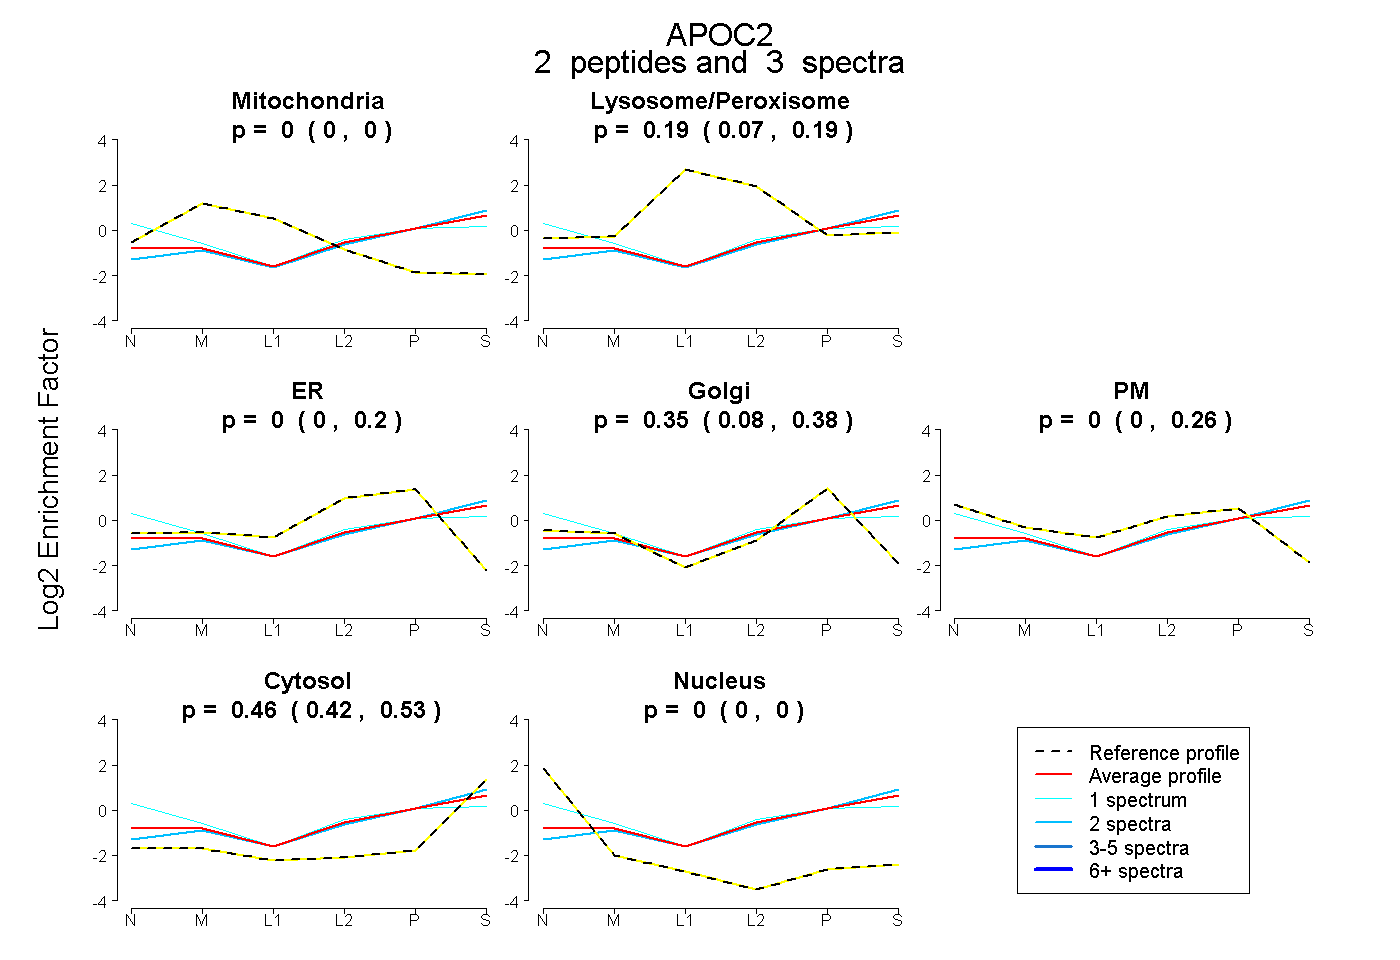 |
0.000
0.000 | 0.000 |
|
0.186
0.072 | 0.194 |
|
0.000
0.000 | 0.200 |
0.354
0.084 | 0.375 |
0.000
0.000 | 0.263 |
0.459
0.420 | 0.529 |
0.000
0.000 | 0.000 |
|
| | | Plot |
|
Lyso |
|
|
|
|
|
|
|
Other |
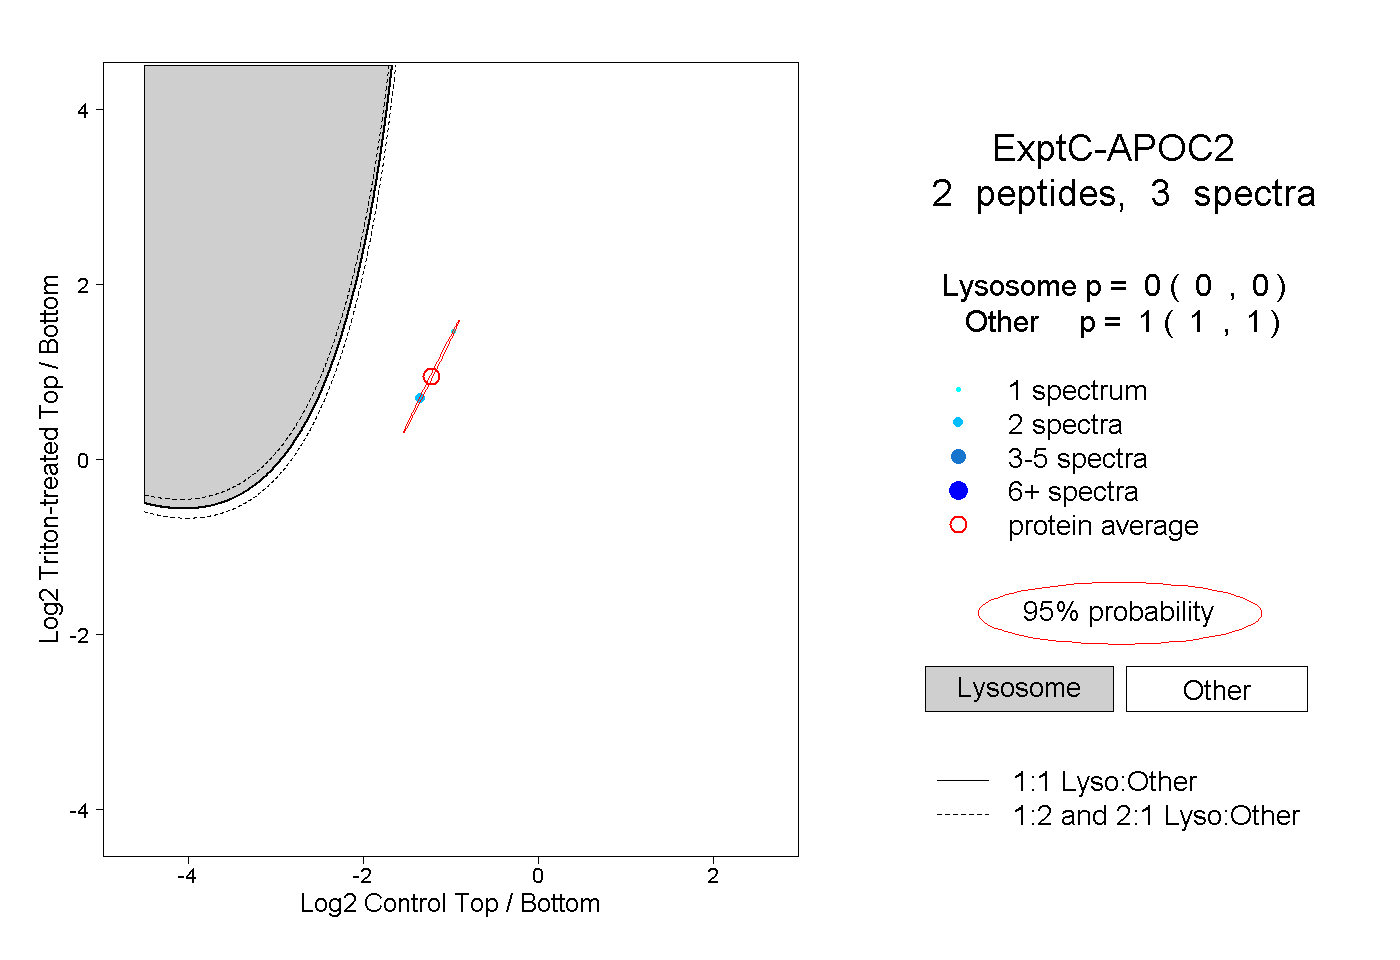
| Expt C |
2
peptides |
3
spectra |
 |
|
0.000
0.000 | 0.000 |
|
|
|
|
|
|
|
1.000
1.000 | 1.000 |
| 2 spectra, AAAGELYQK |
|
0.000 |
|
|
|
|
|
|
|
1.000 |
| 1 spectrum, TYLTSVDEK |
|
0.000 |
|
|
|
|
|
|
|
1.000 |
| | | Plot |
|
Lyso |
|
|
|
|
|
|
|
Other |
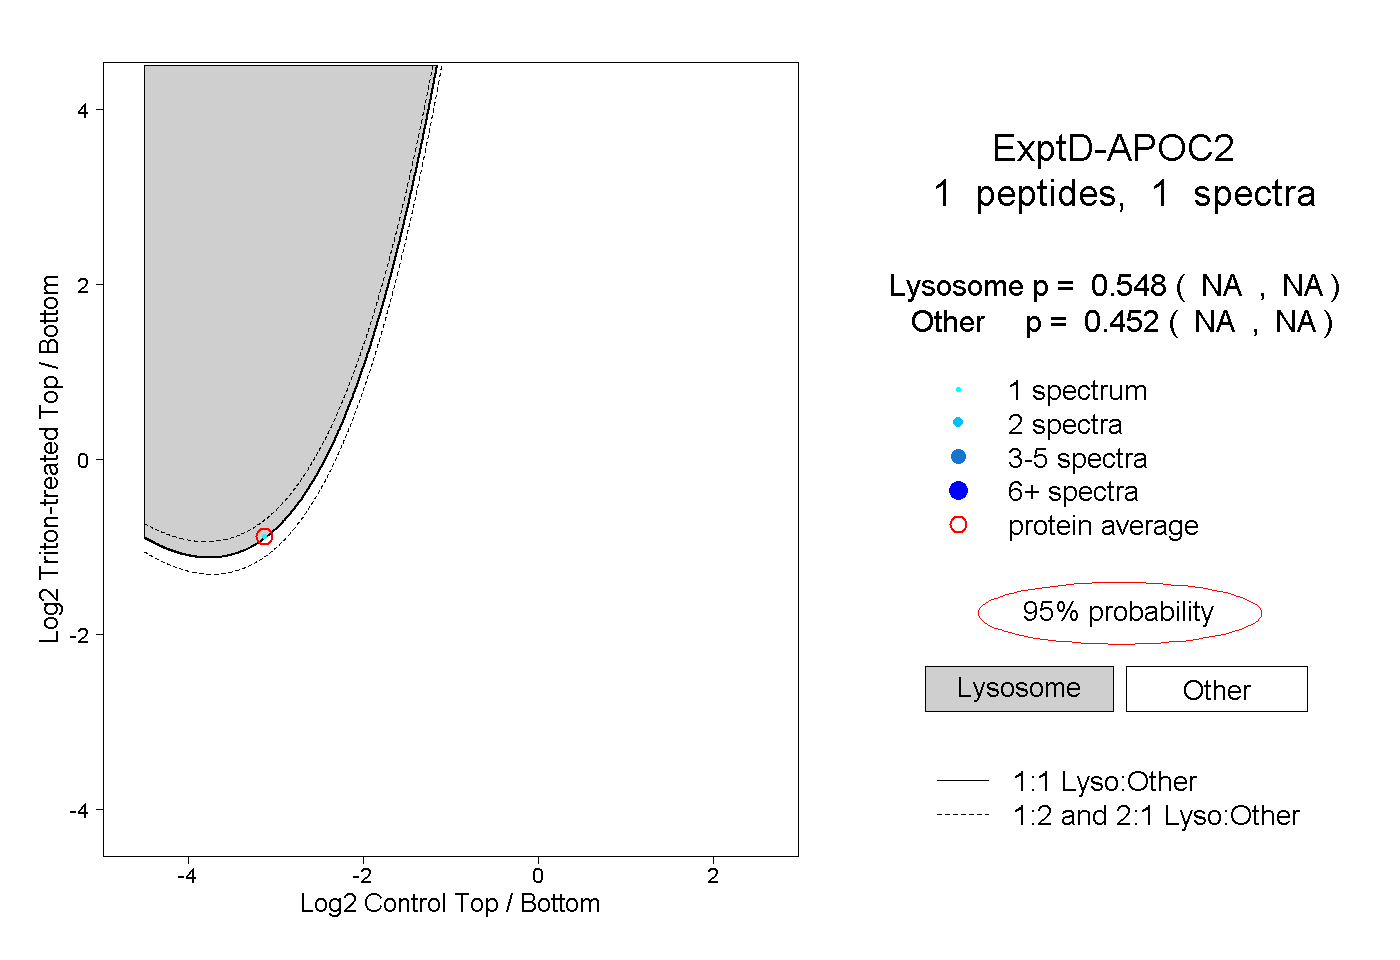
| Expt D |
1
peptide |
1
spectrum |
 |
|
0.548
NA | NA |
|
|
|
|
|
|
|
0.452
NA | NA |