14
14peptides
spectra
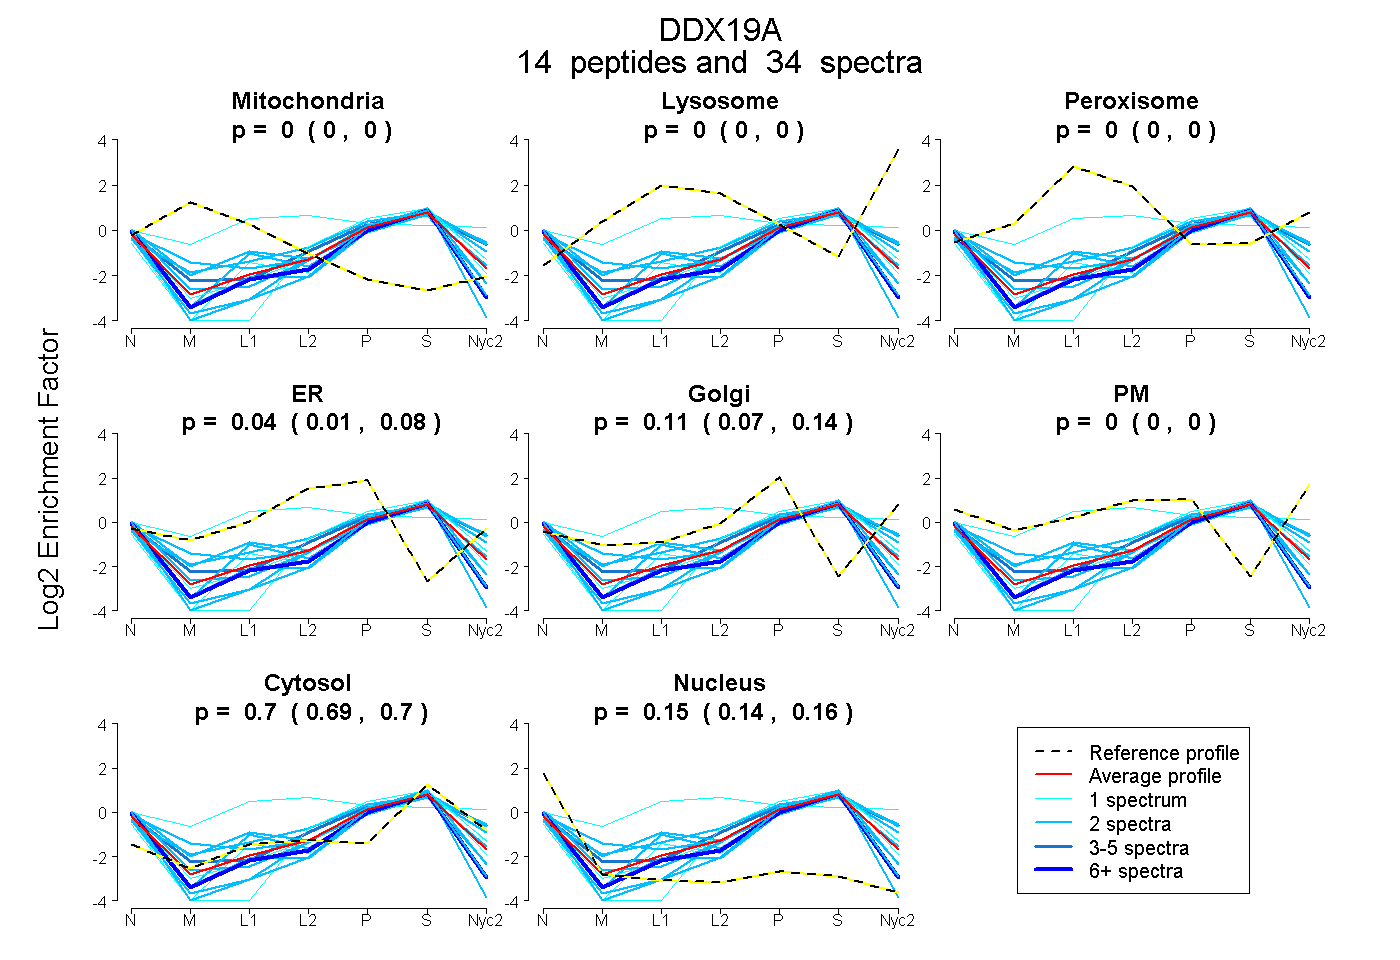
0.000 | 0.000
0.000 | 0.000
0.000 | 0.000
0.007 | 0.077
0.066 | 0.144
0.000 | 0.000
0.693 | 0.703
0.140 | 0.156
5peptides
spectra
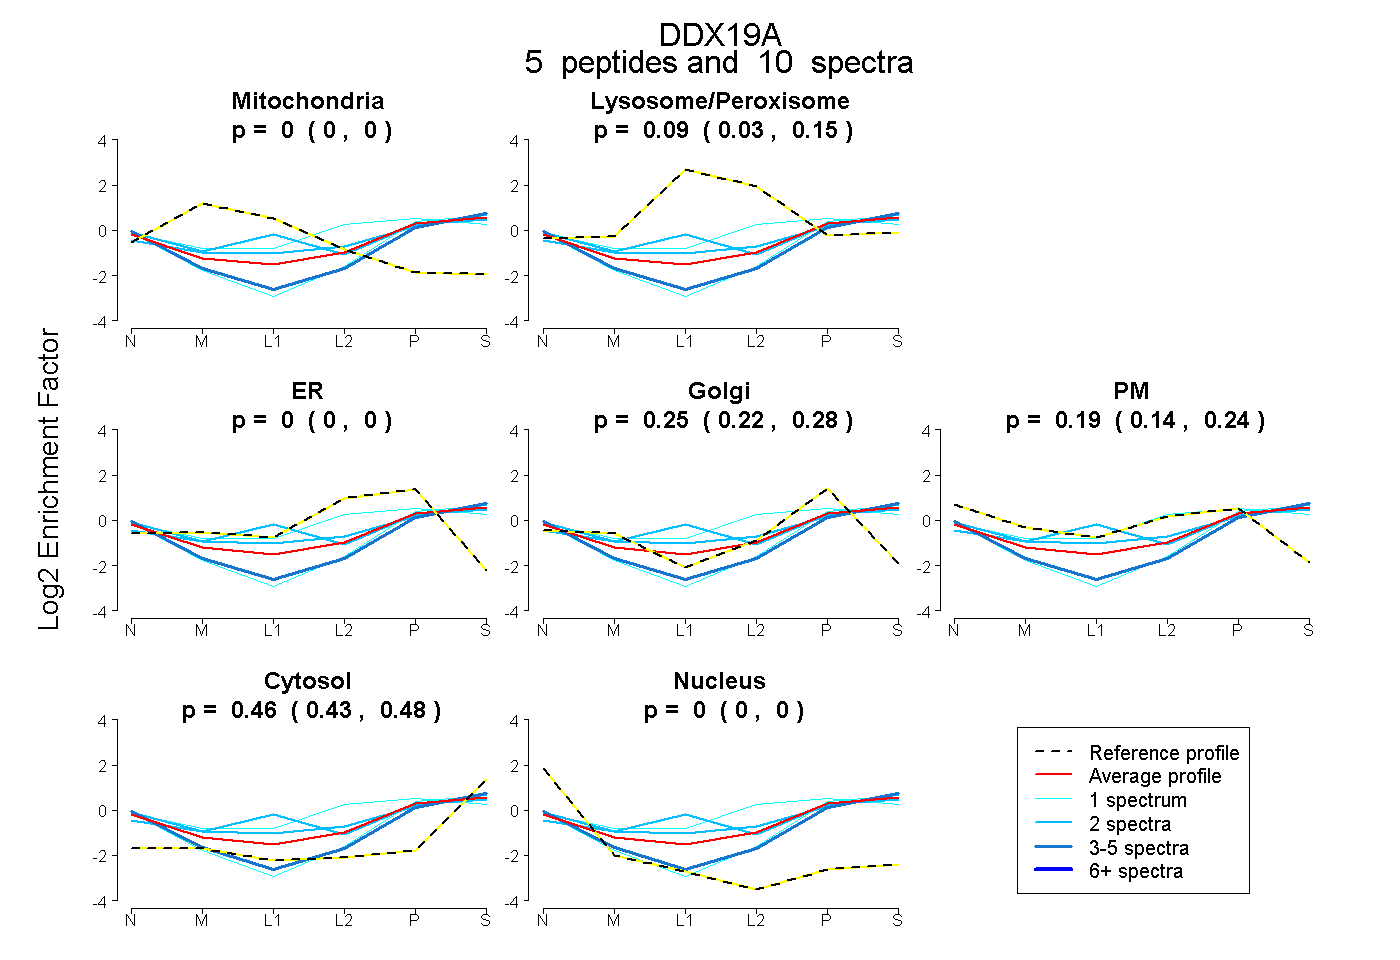
0.000 | 0.000
0.029 | 0.145
0.000 | 0.000
0.220 | 0.279
0.137 | 0.244
0.434 | 0.480
0.000 | 0.000