 11
11peptides
spectra
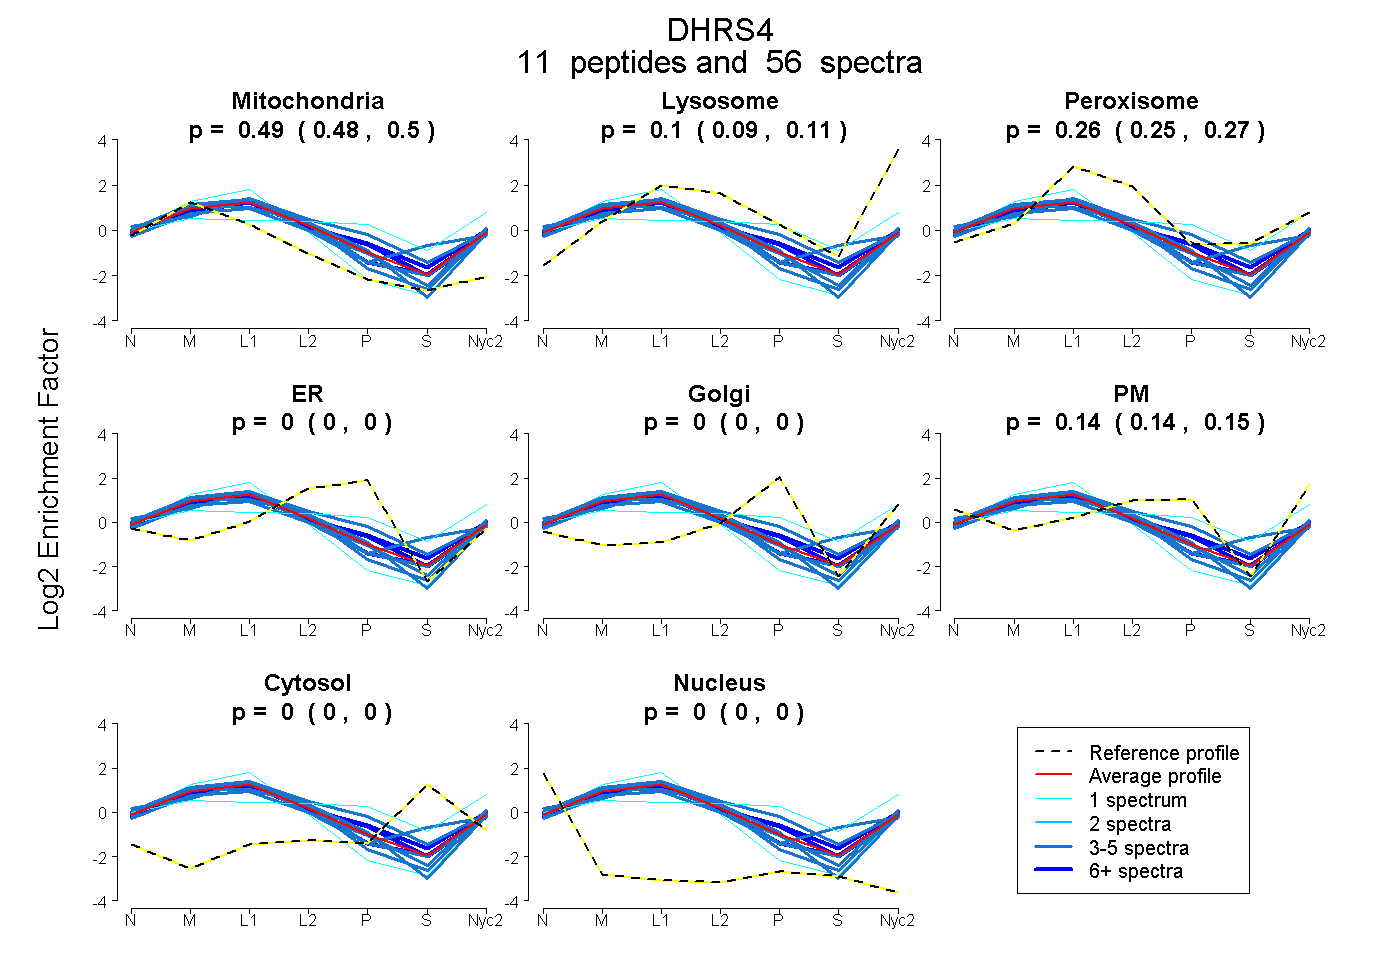
0.484 | 0.495
0.094 | 0.106
0.255 | 0.272
0.000 | 0.000
0.000 | 0.000
0.135 | 0.153
0.000 | 0.000
0.000 | 0.000
11peptides
spectra
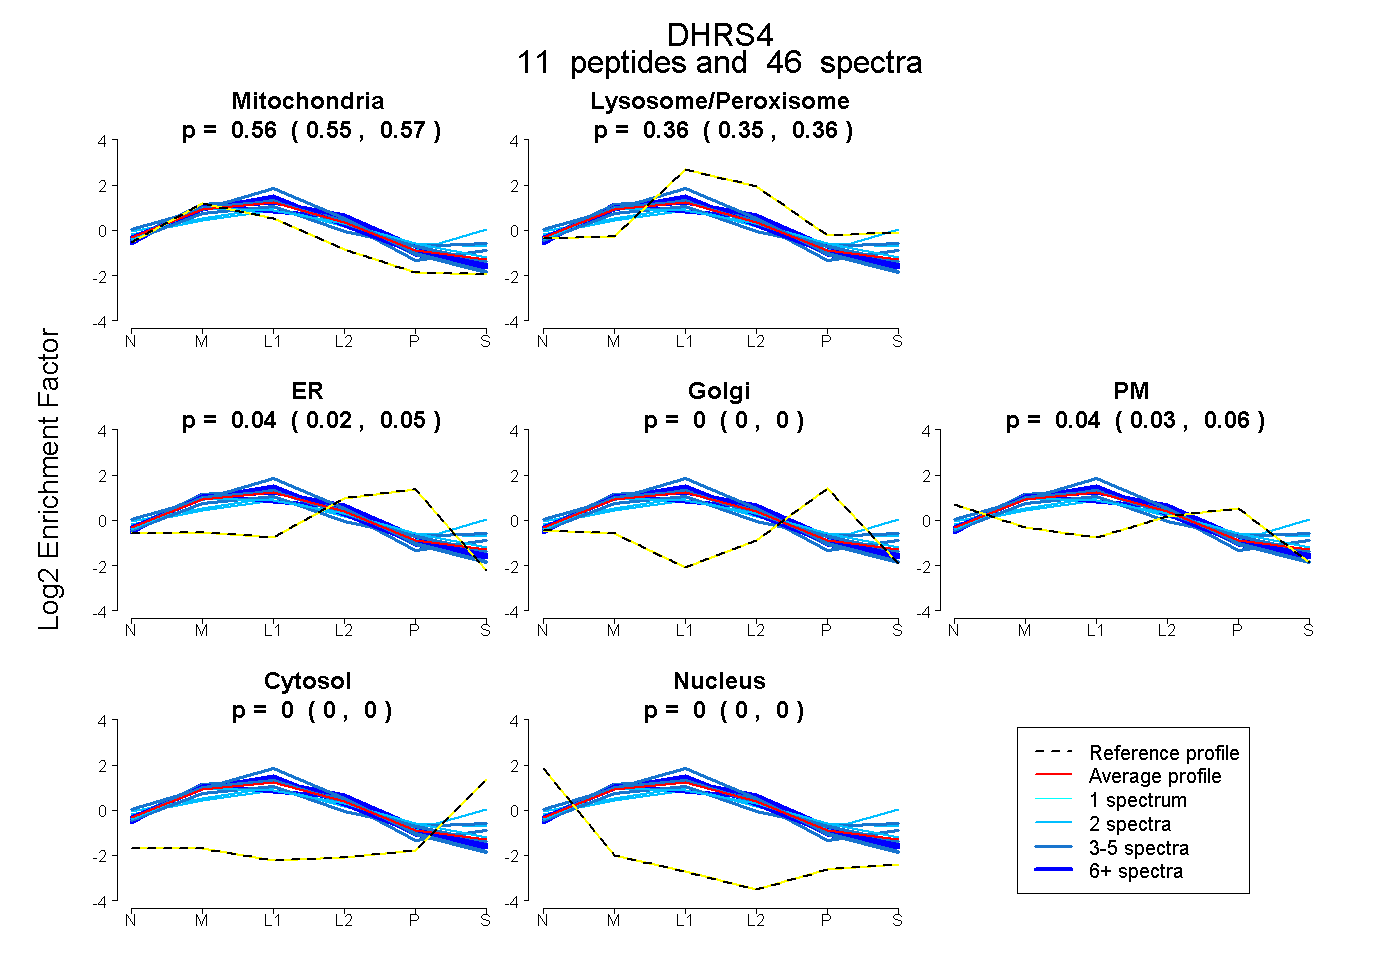
0.553 | 0.566
0.350 | 0.365
0.024 | 0.049
0.000 | 0.000
0.030 | 0.055
0.000 | 0.000
0.000 | 0.000
11peptides
spectra
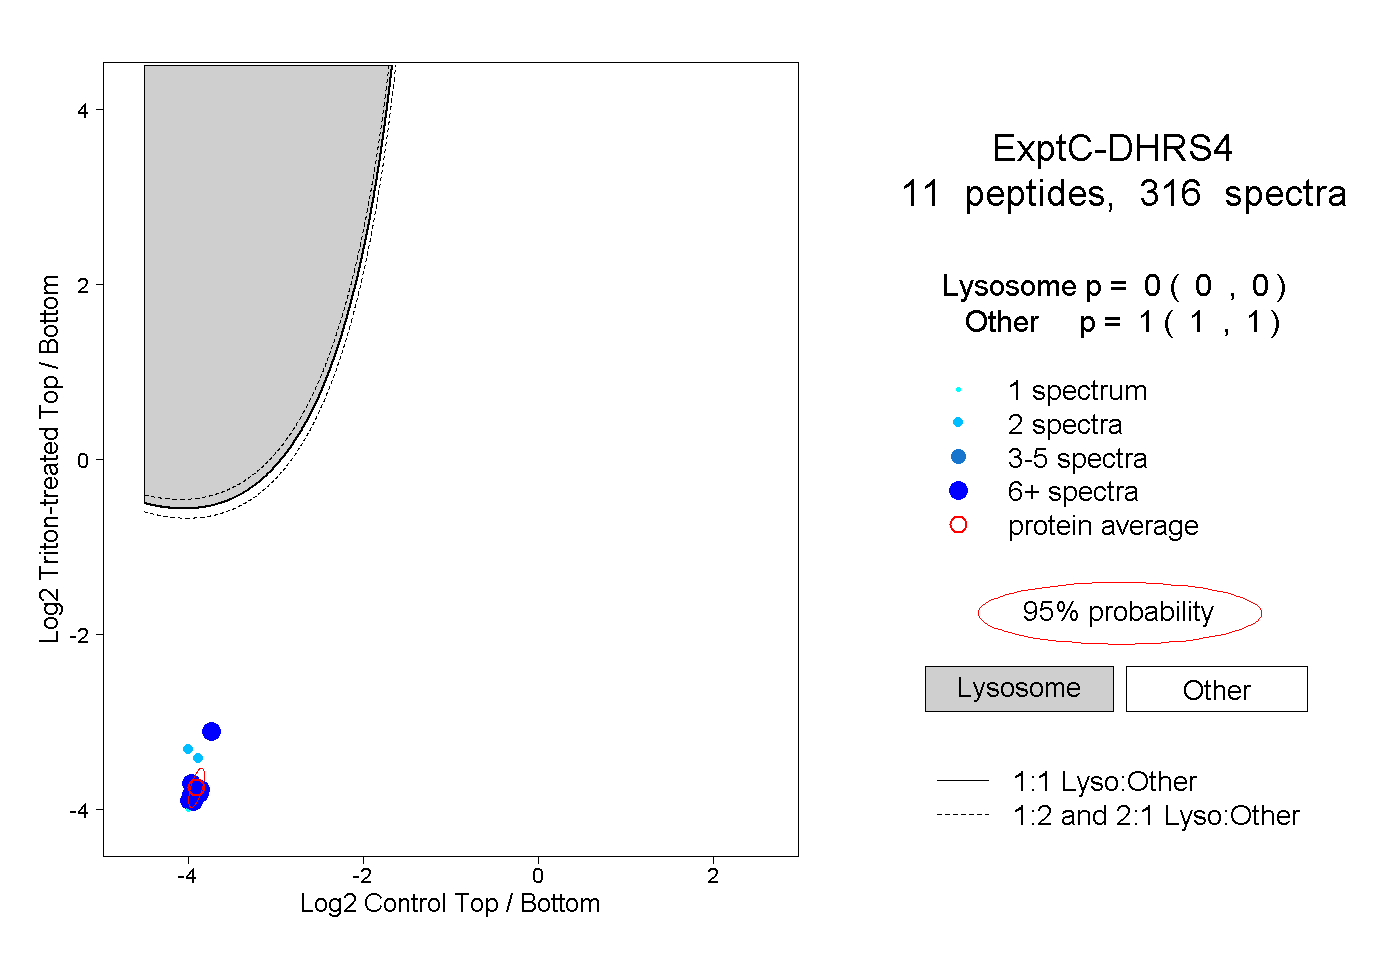
0.000 | 0.000
1.000 | 1.000
9peptides
spectra
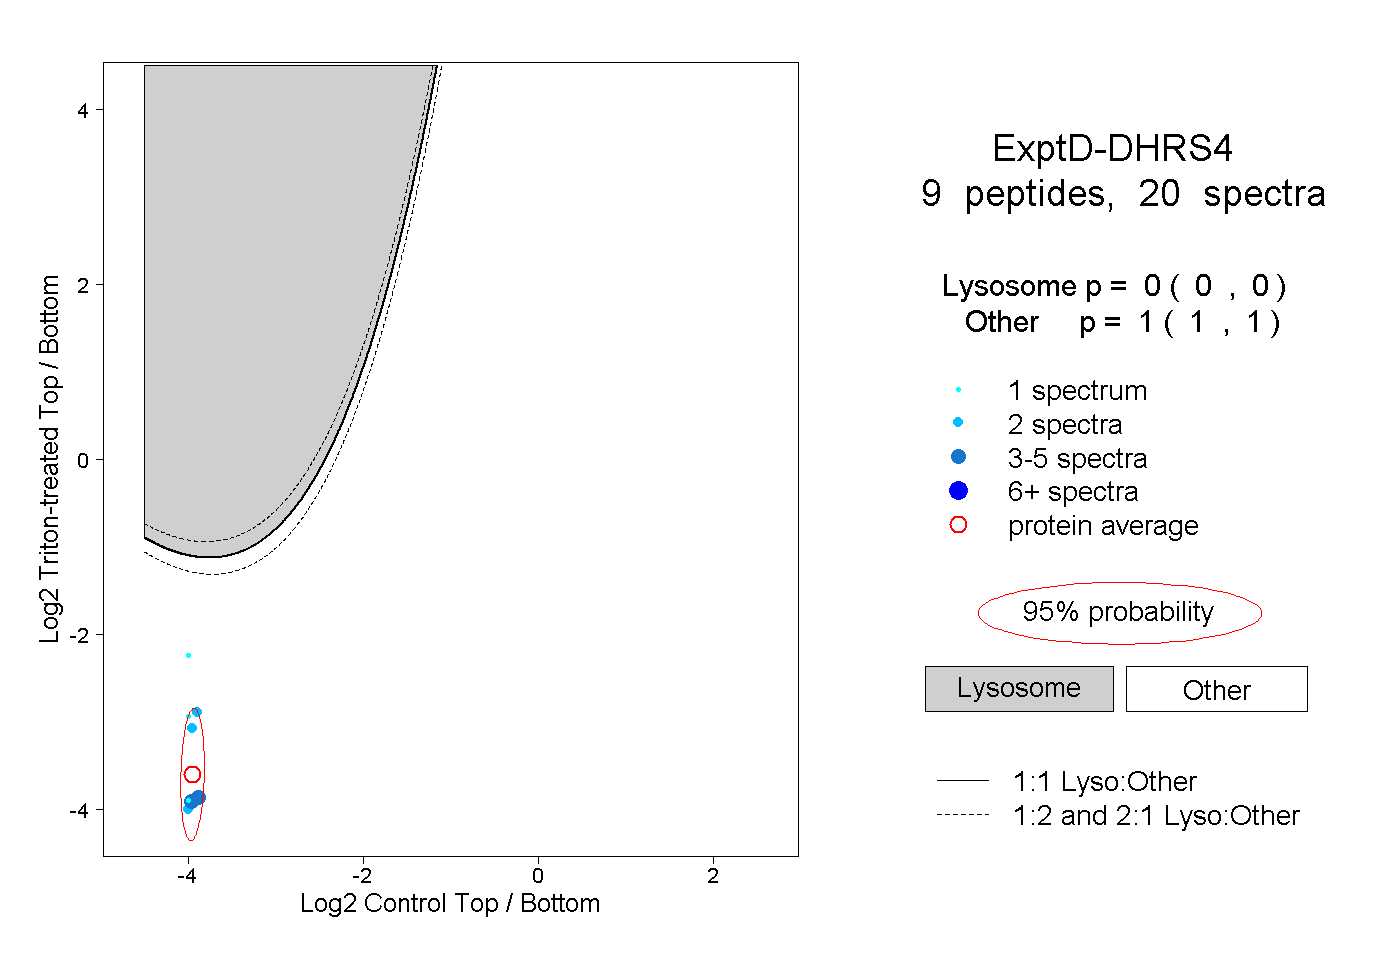
0.000 | 0.000
1.000 | 1.000