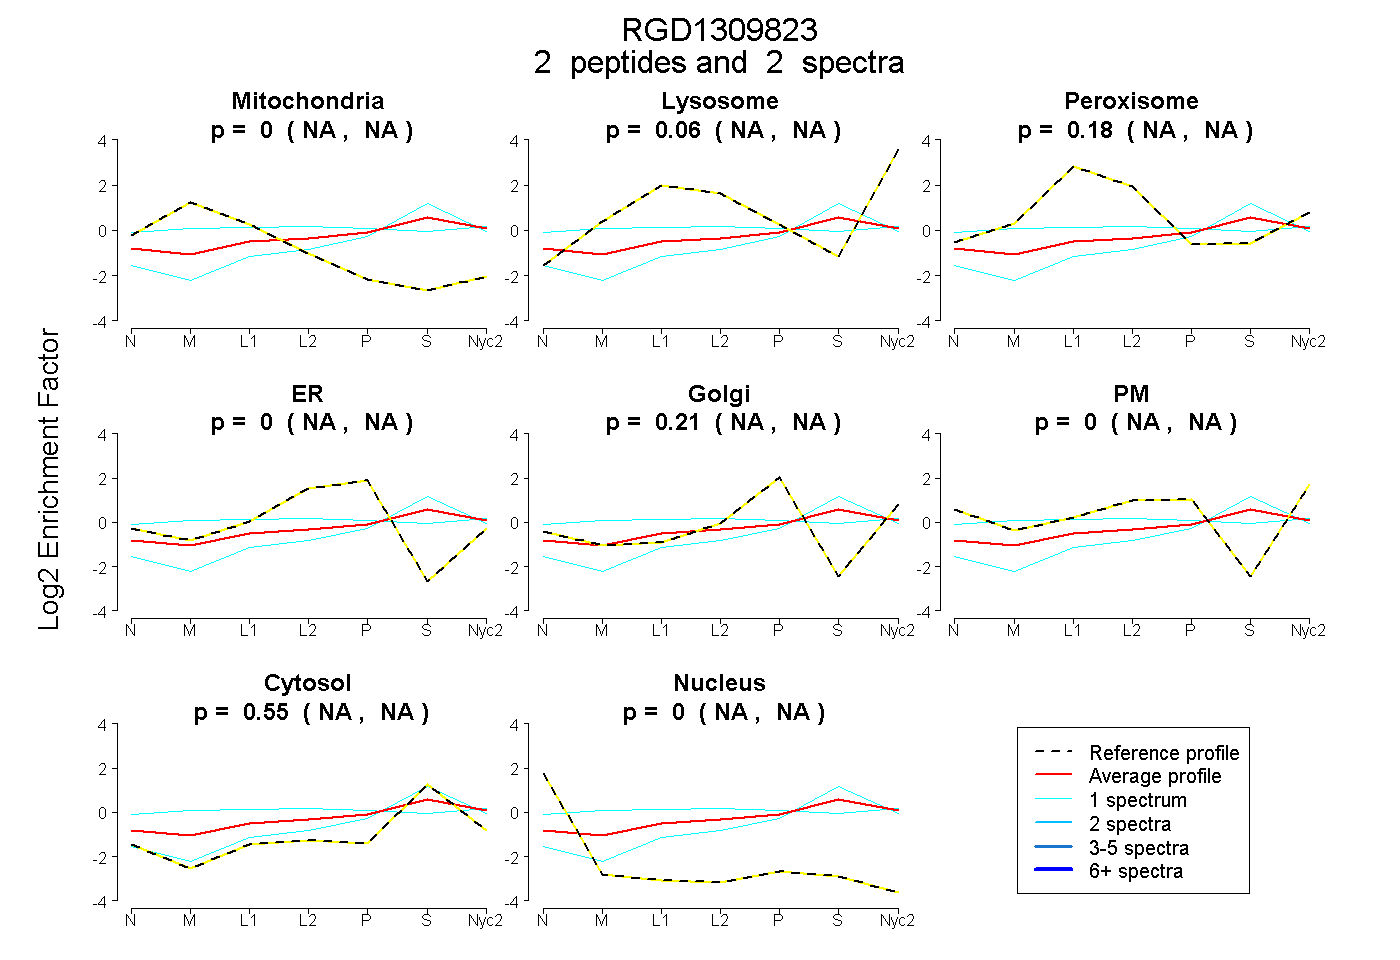
 2
2peptides
spectra
NA | NA
NA | NA
NA | NA
NA | NA
NA | NA
NA | NA
NA | NA
NA | NA
| Plot | Mito | Lyso | Perox | ER | Golgi | PM | Cytosol | Nucleus | |||||
| Expt A |
2 peptides |
2 spectra |
|
0.000 NA | NA |
0.060 NA | NA |
0.181 NA | NA |
0.000 NA | NA |
0.206 NA | NA |
0.000 NA | NA |
0.553 NA | NA |
0.000 NA | NA |
| 1 spectrum, FEDFEPSDTR | 0.000 | 0.099 | 0.000 | 0.000 | 0.101 | 0.000 | 0.800 | 0.000 | ||
| 1 spectrum, VCGDPEVTVDALR | 0.088 | 0.000 | 0.296 | 0.000 | 0.092 | 0.224 | 0.301 | 0.000 |
| Plot | Lyso | Other | |||||||||||
| Expt C |
2 peptides |
5 spectra |
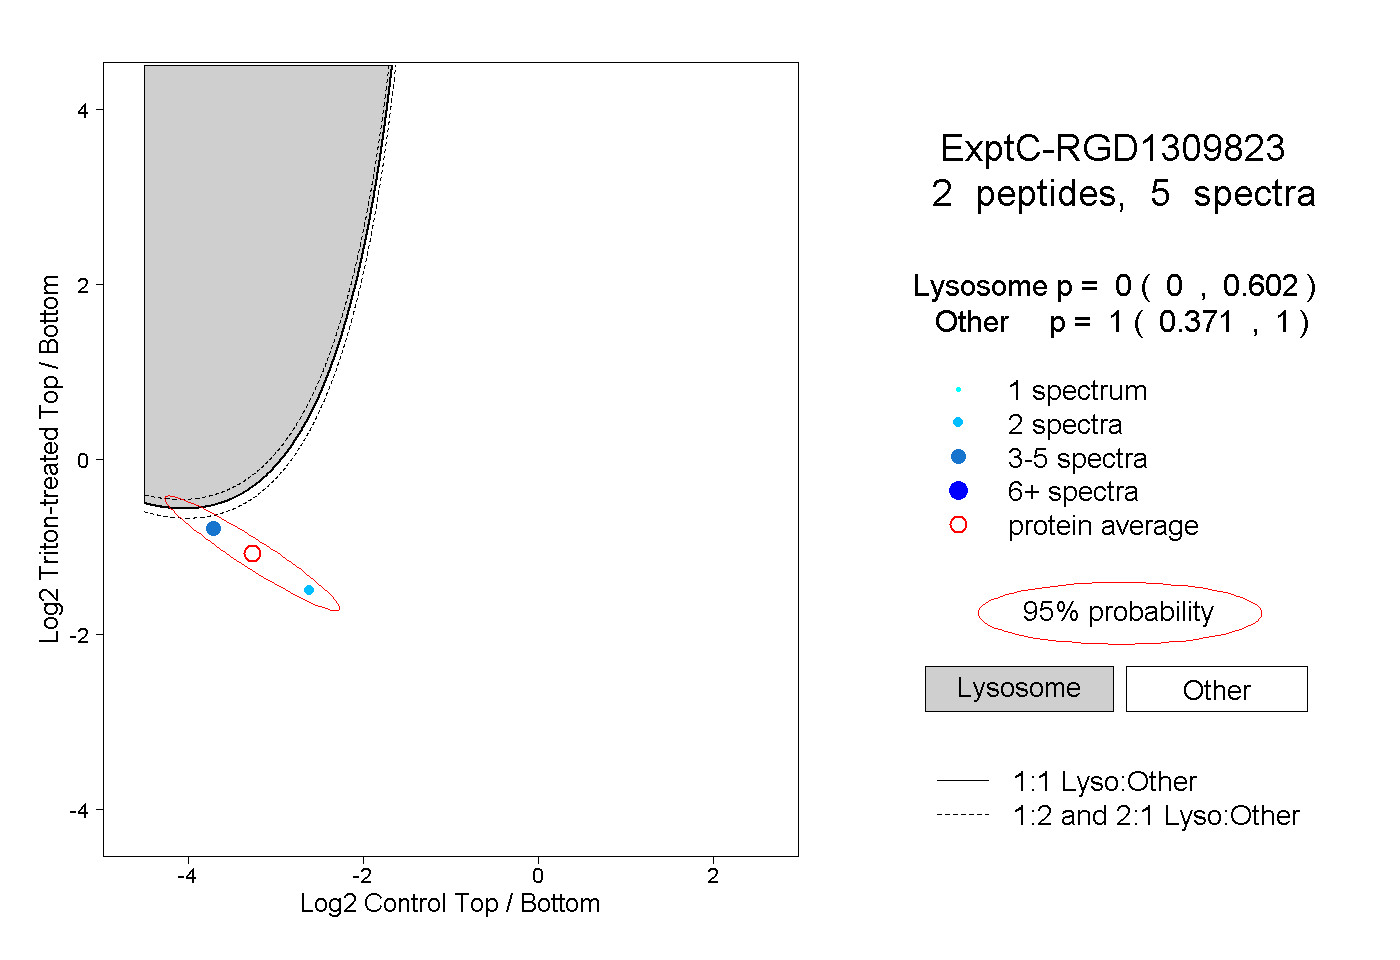 |
0.000 0.000 | 0.602 |
1.000 0.371 | 1.000 |