 11
11peptides
spectra
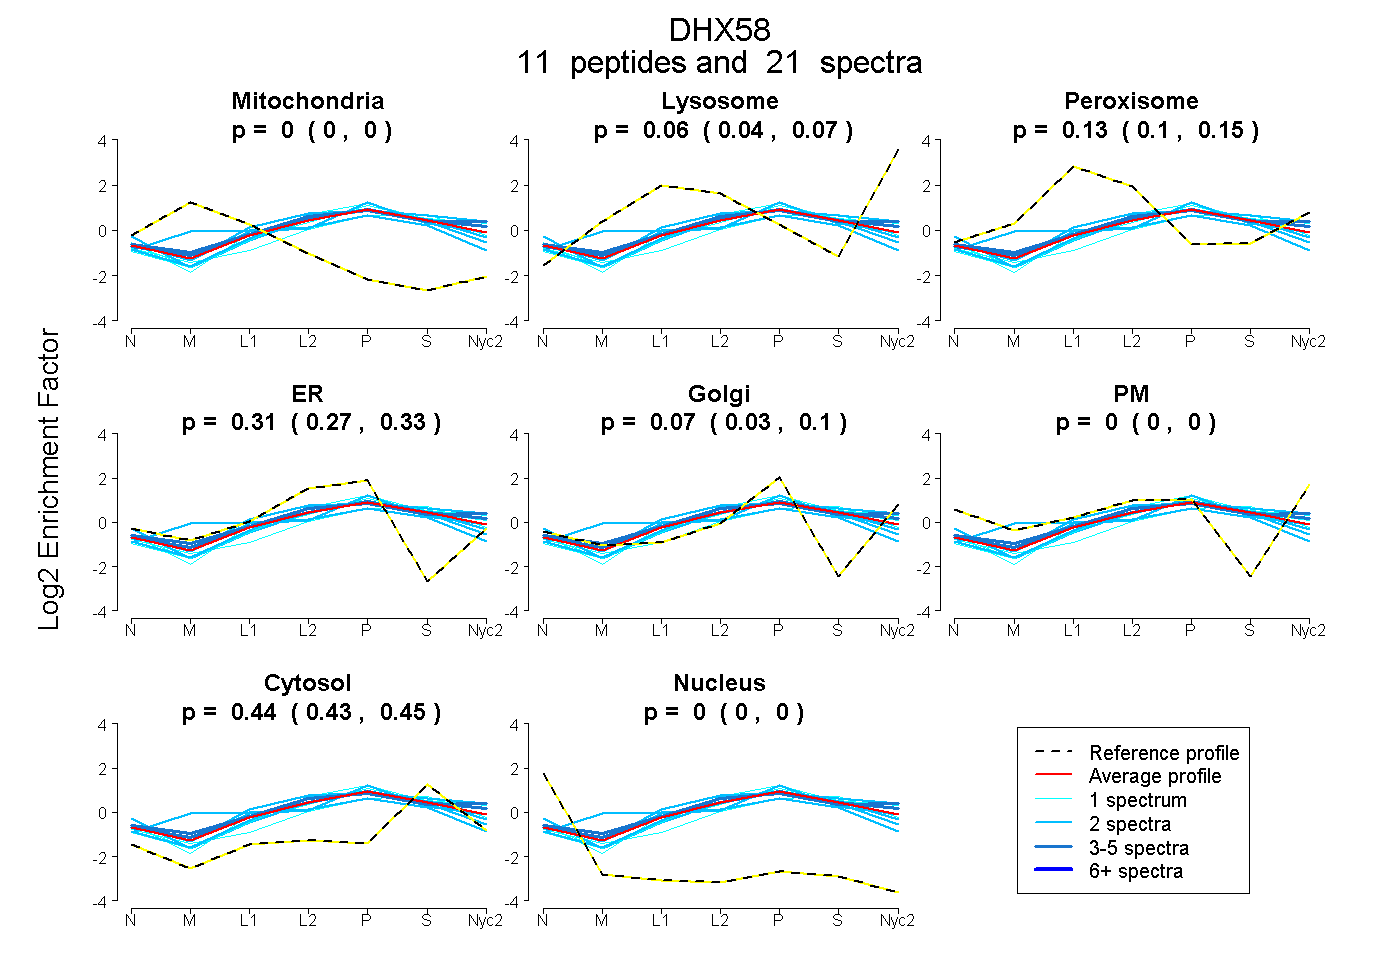
0.000 | 0.000
0.037 | 0.074
0.102 | 0.147
0.274 | 0.334
0.032 | 0.096
0.000 | 0.000
0.433 | 0.451
0.000 | 0.000
4peptides
spectra
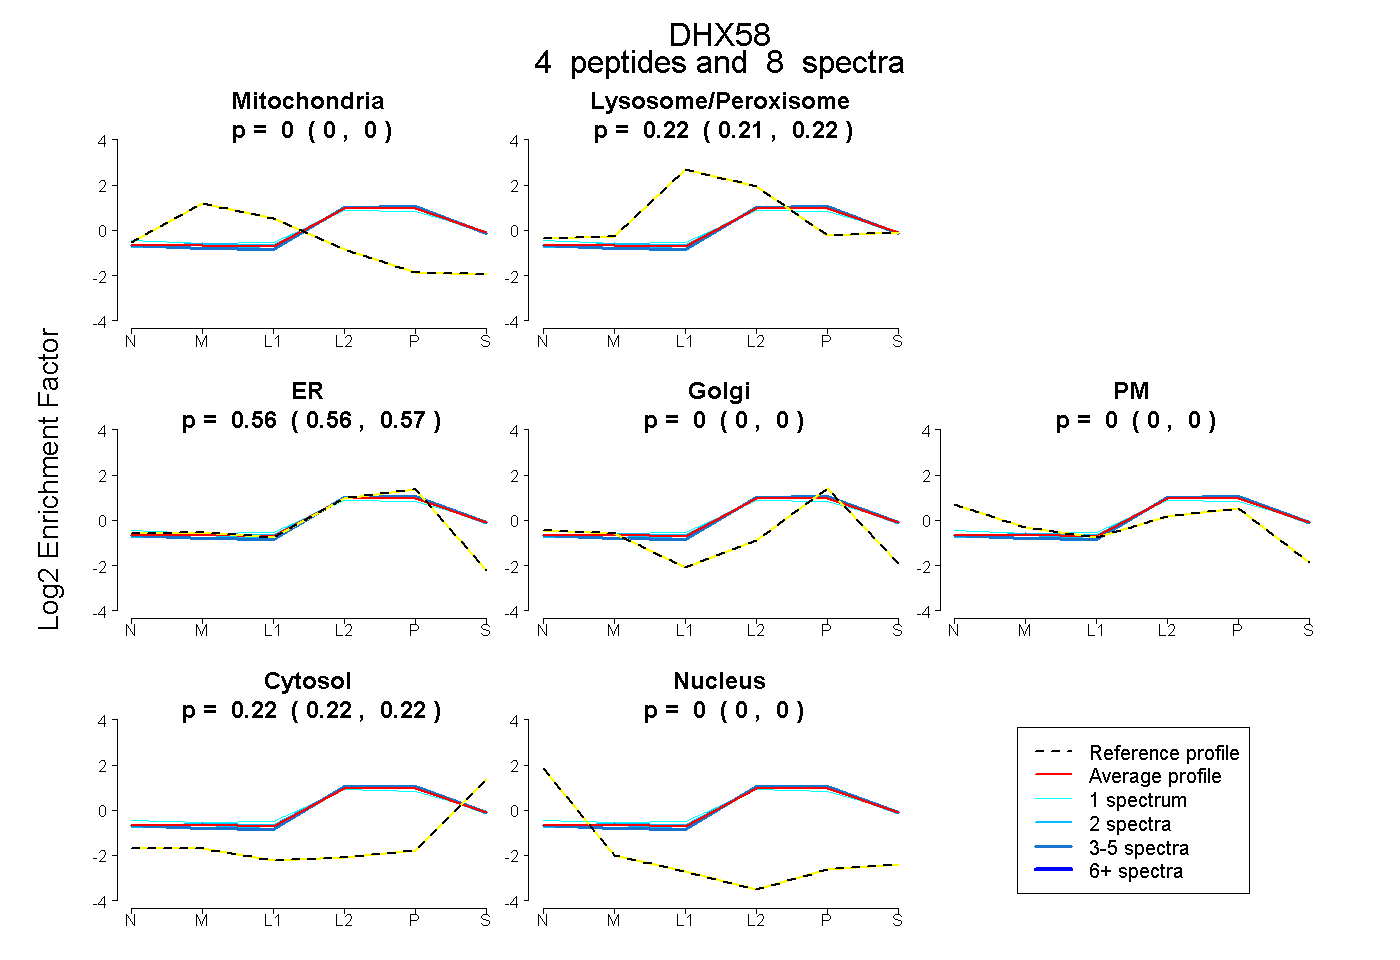
0.000 | 0.000
0.206 | 0.224
0.555 | 0.571
0.000 | 0.000
0.000 | 0.000
0.216 | 0.225
0.000 | 0.000
6peptides
spectra
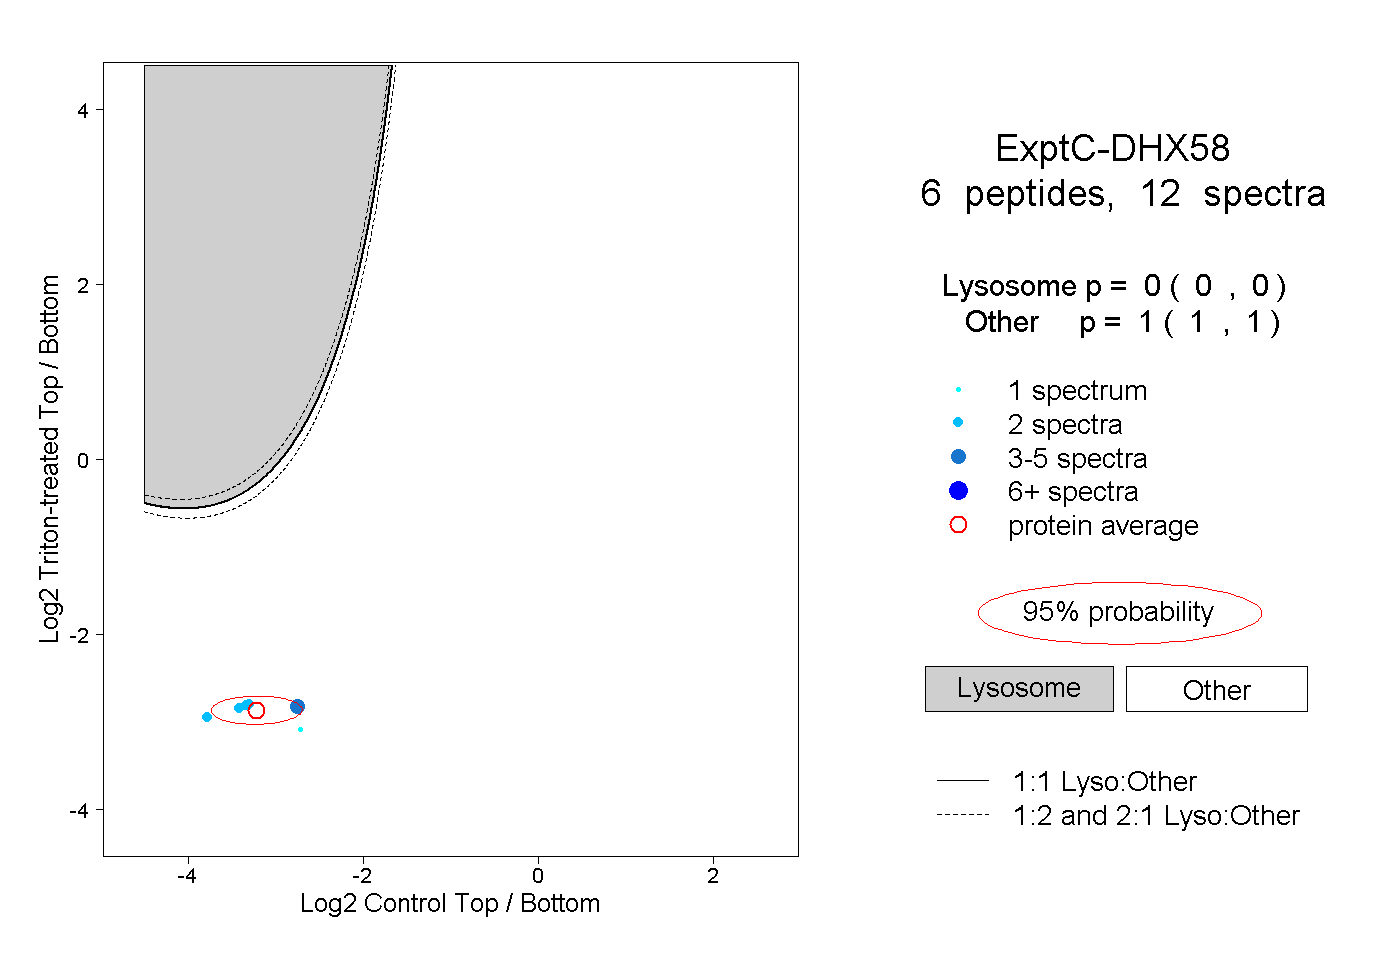
0.000 | 0.000
1.000 | 1.000
6peptides
spectra
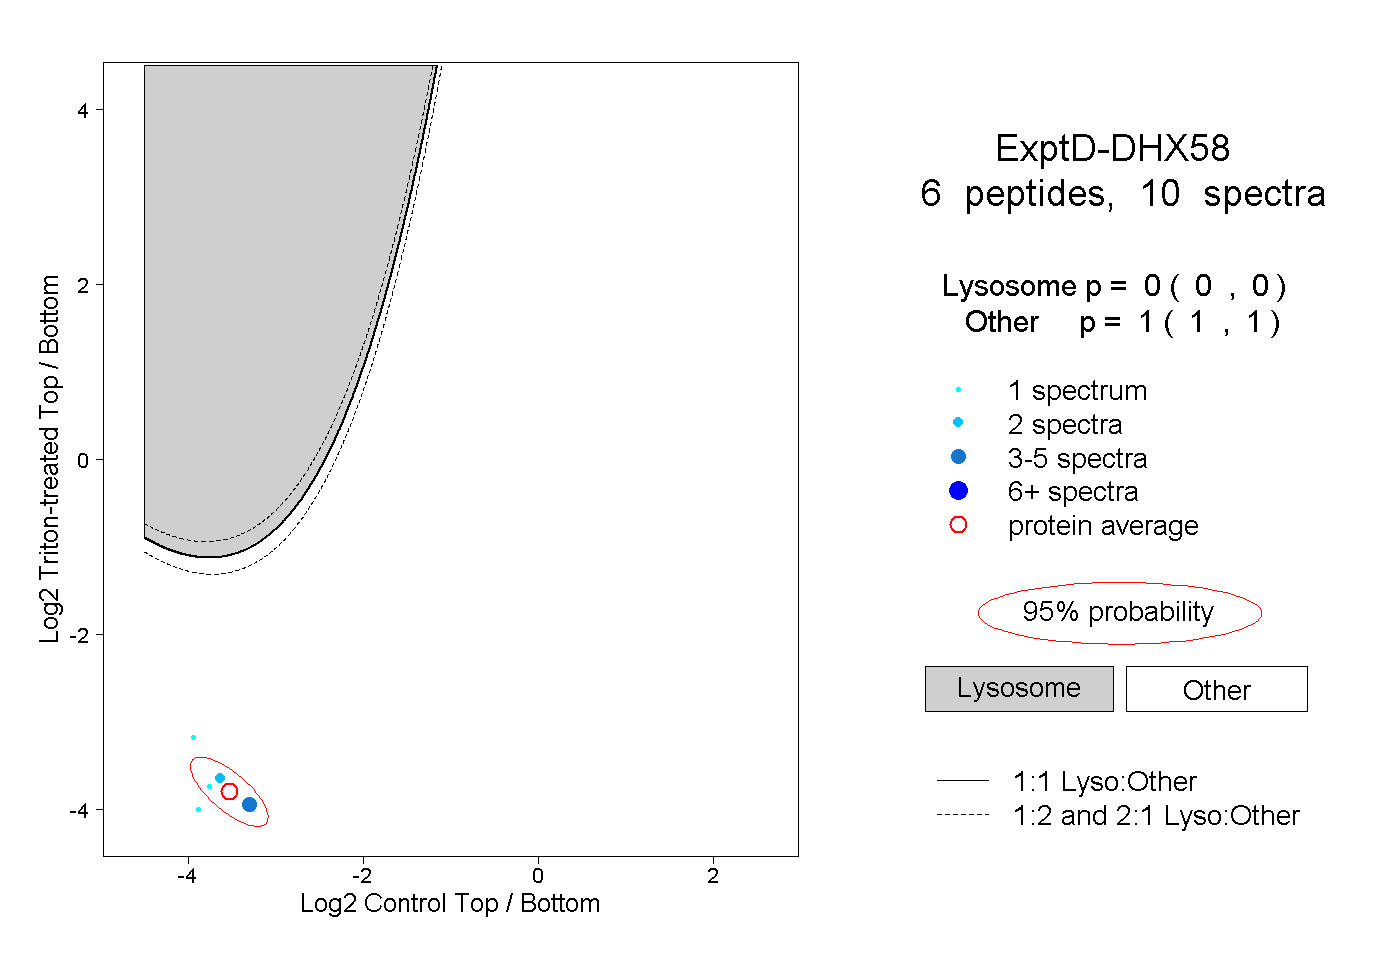
0.000 | 0.000
1.000 | 1.000