32
32peptides
spectra
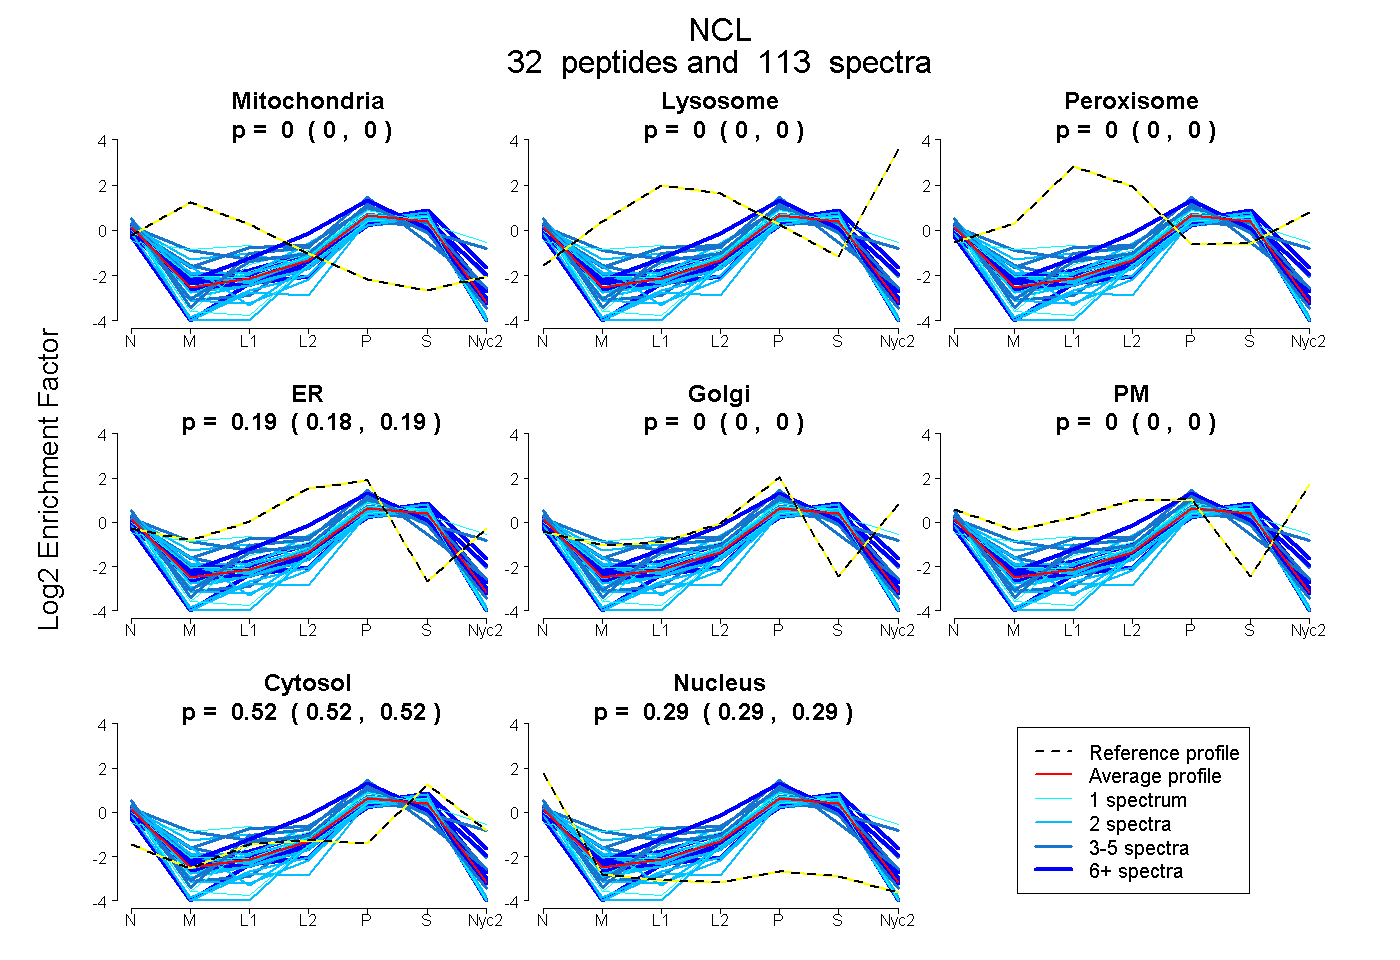
0.000 | 0.000
0.000 | 0.000
0.000 | 0.000
0.183 | 0.187
0.000 | 0.000
0.000 | 0.000
0.520 | 0.525
0.289 | 0.294
15peptides
spectra
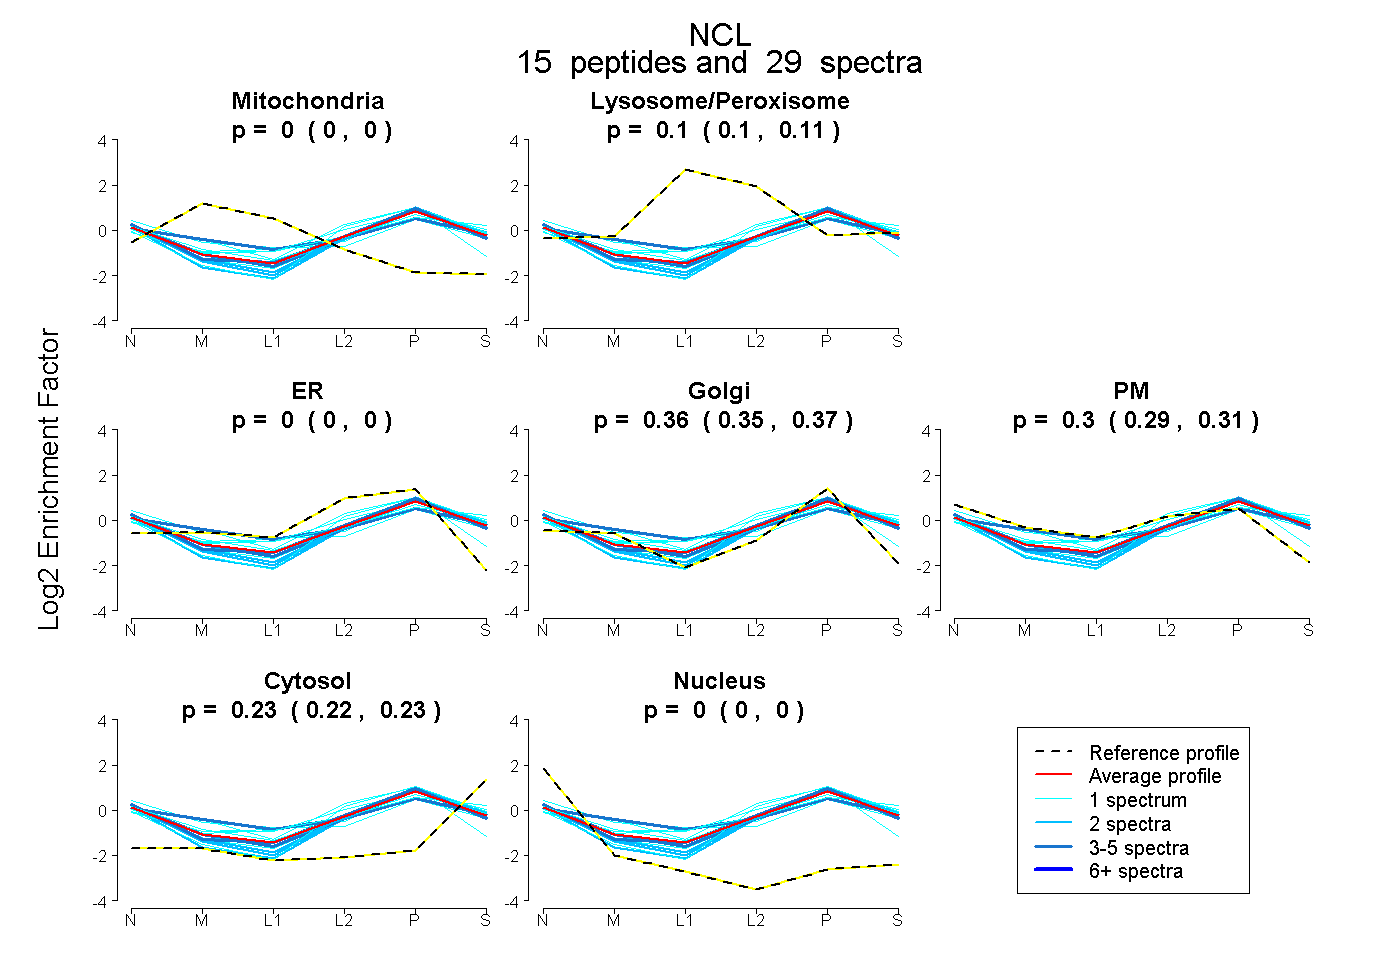
0.000 | 0.000
0.096 | 0.111
0.000 | 0.000
0.354 | 0.372
0.292 | 0.315
0.223 | 0.232
0.000 | 0.000