 8
8peptides
spectra
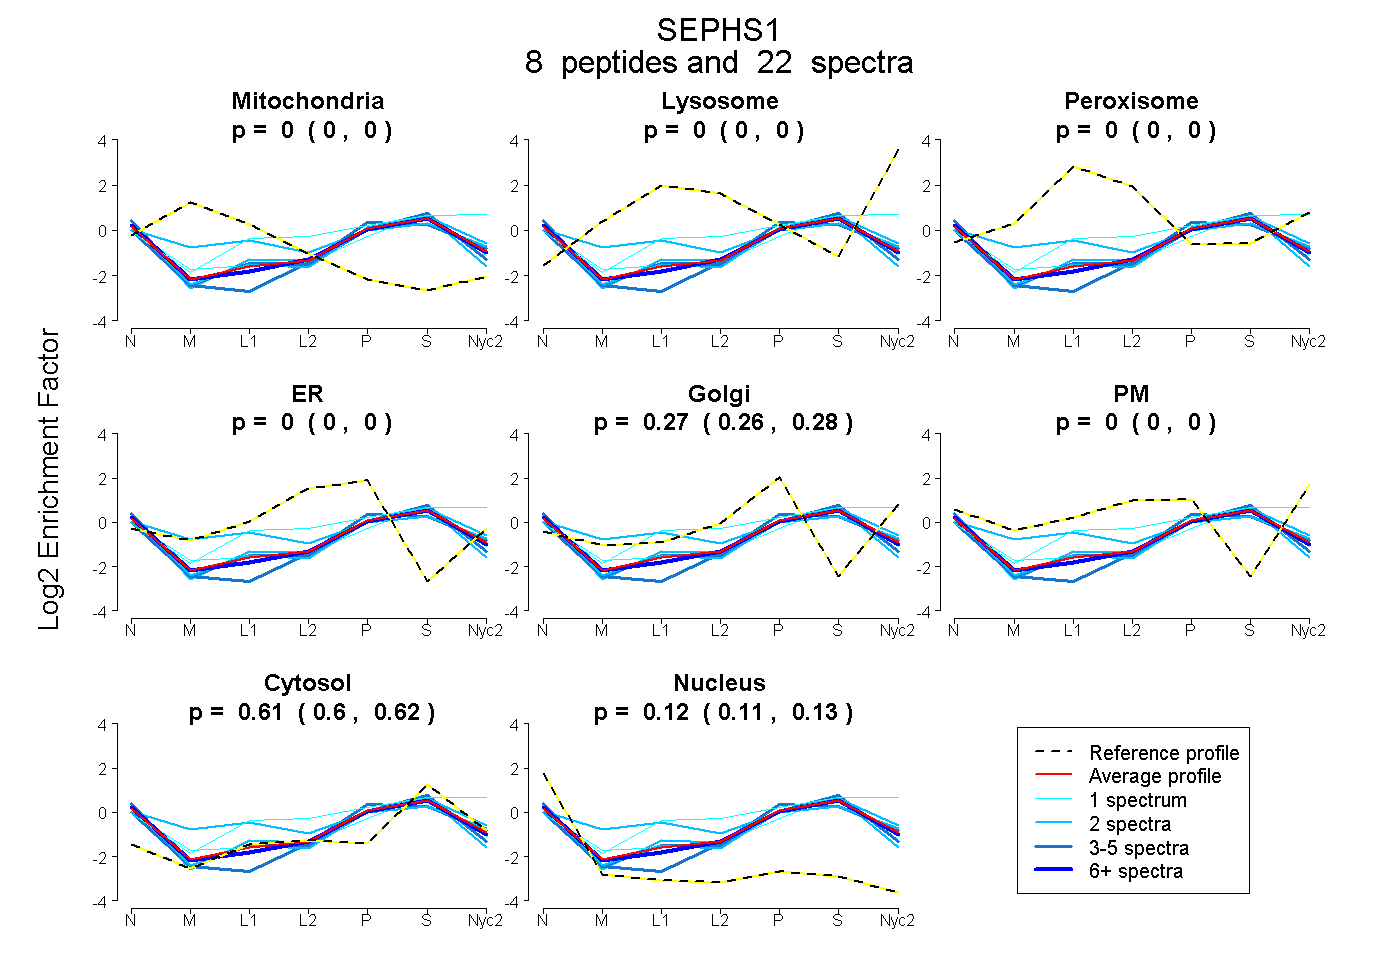
0.000 | 0.000
0.000 | 0.000
0.000 | 0.000
0.000 | 0.000
0.261 | 0.278
0.000 | 0.000
0.603 | 0.617
0.110 | 0.126
3peptides
spectra
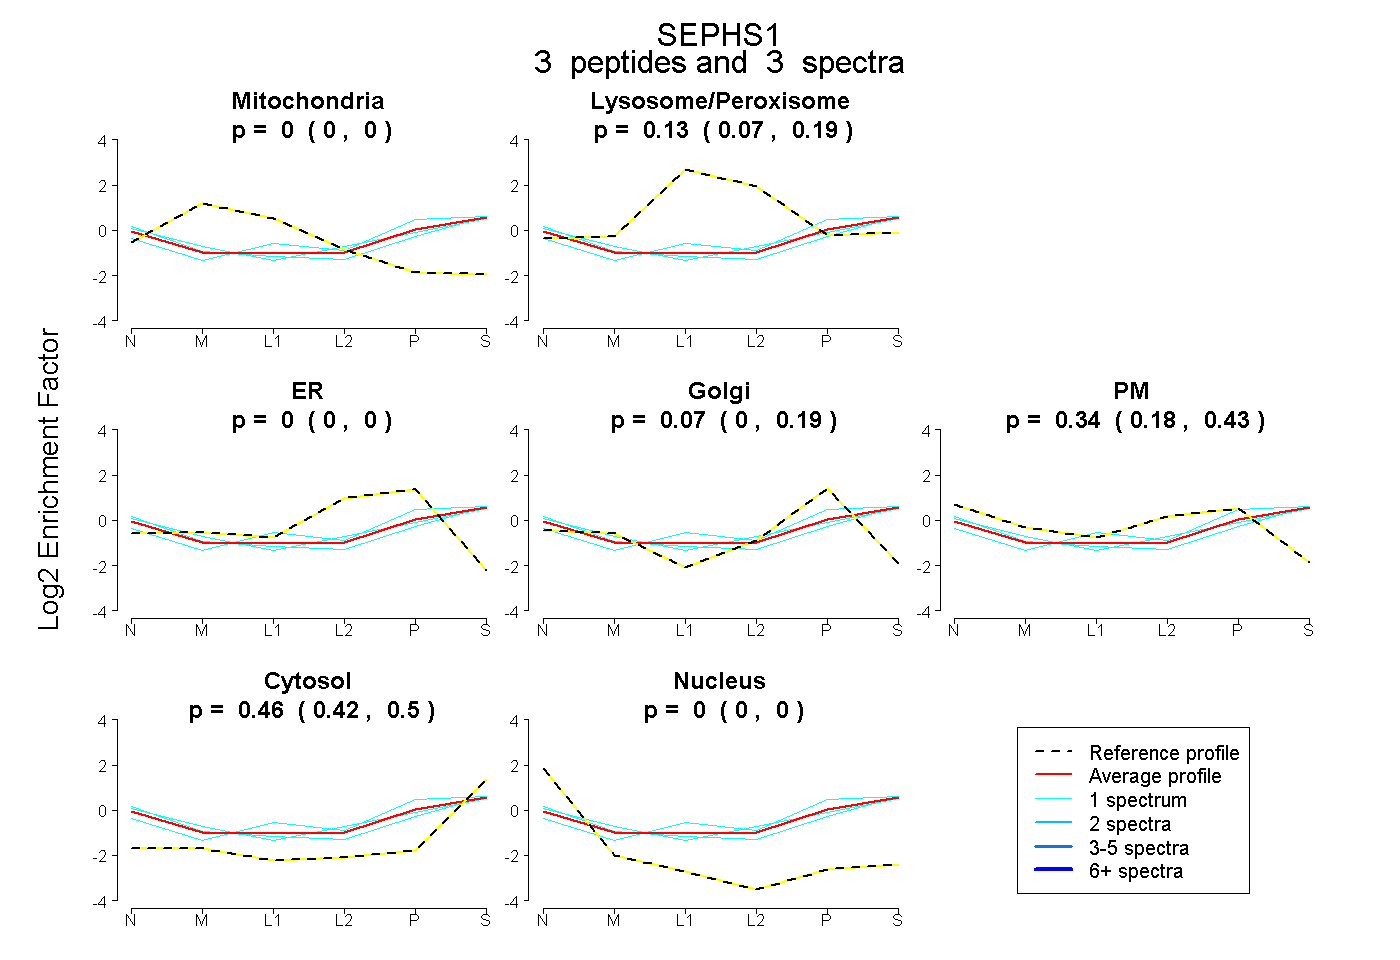
0.000 | 0.000
0.073 | 0.186
0.000 | 0.000
0.000 | 0.187
0.175 | 0.427
0.418 | 0.497
0.000 | 0.000
6peptides
spectra
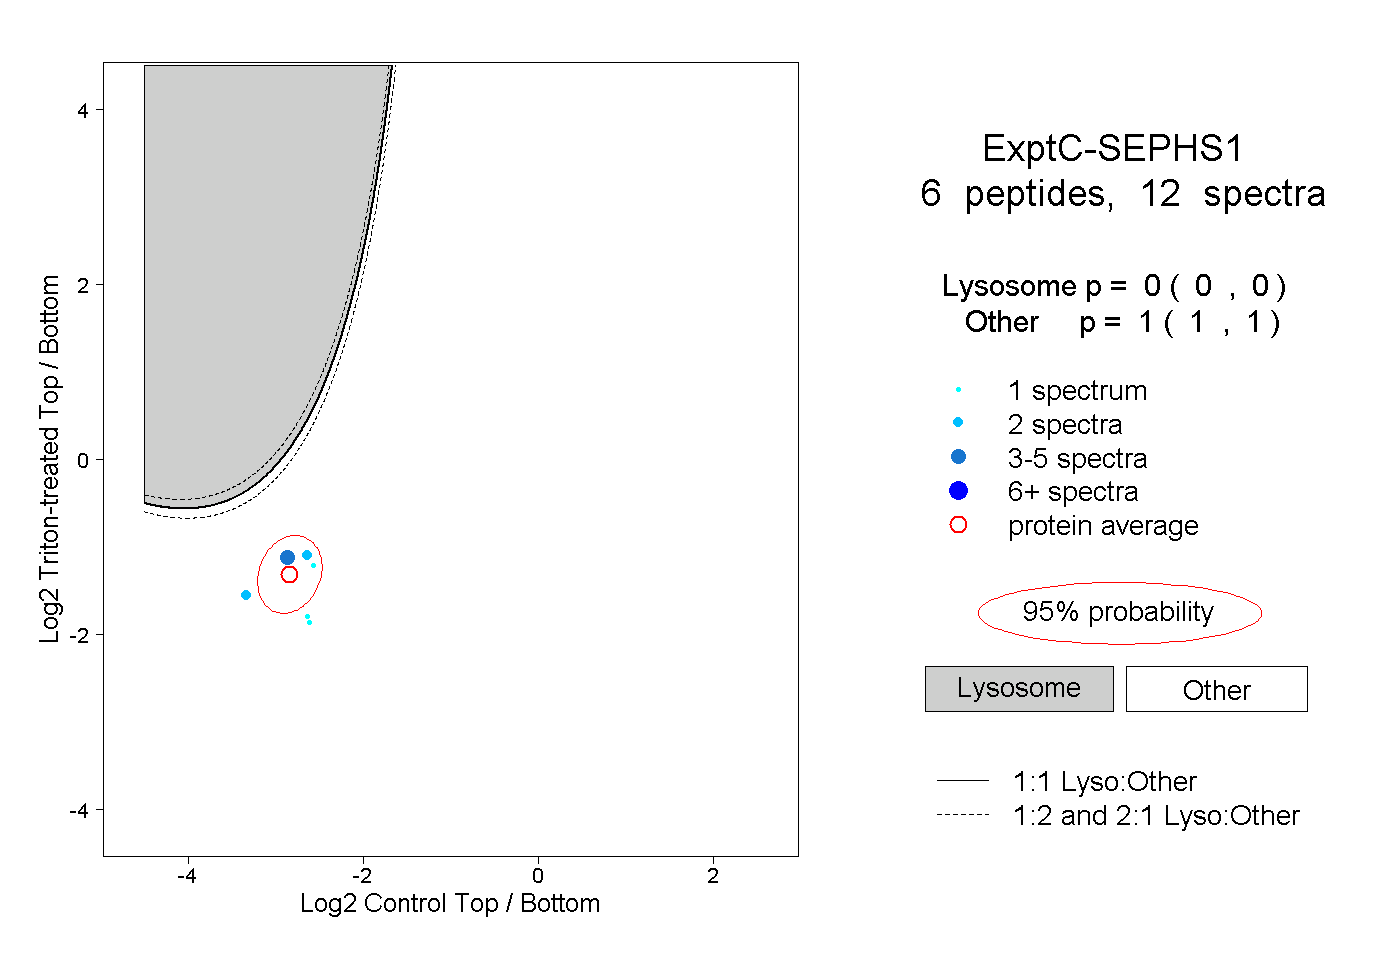
0.000 | 0.000
1.000 | 1.000