 4
4peptides
spectra
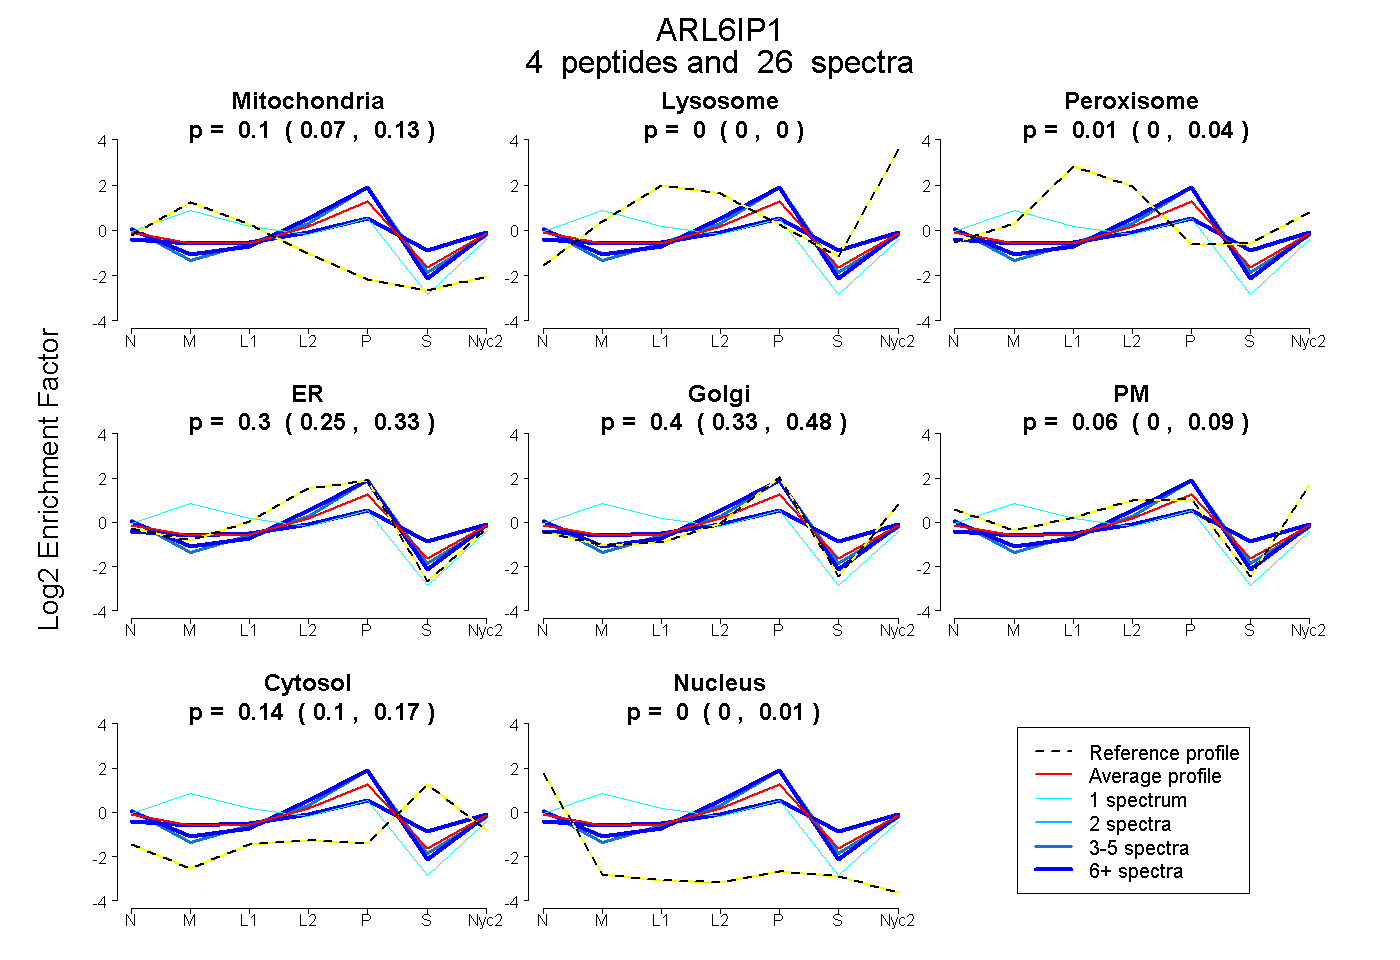
0.068 | 0.127
0.000 | 0.000
0.000 | 0.036
0.246 | 0.331
0.330 | 0.477
0.000 | 0.095
0.102 | 0.167
0.000 | 0.006
1peptide
spectra
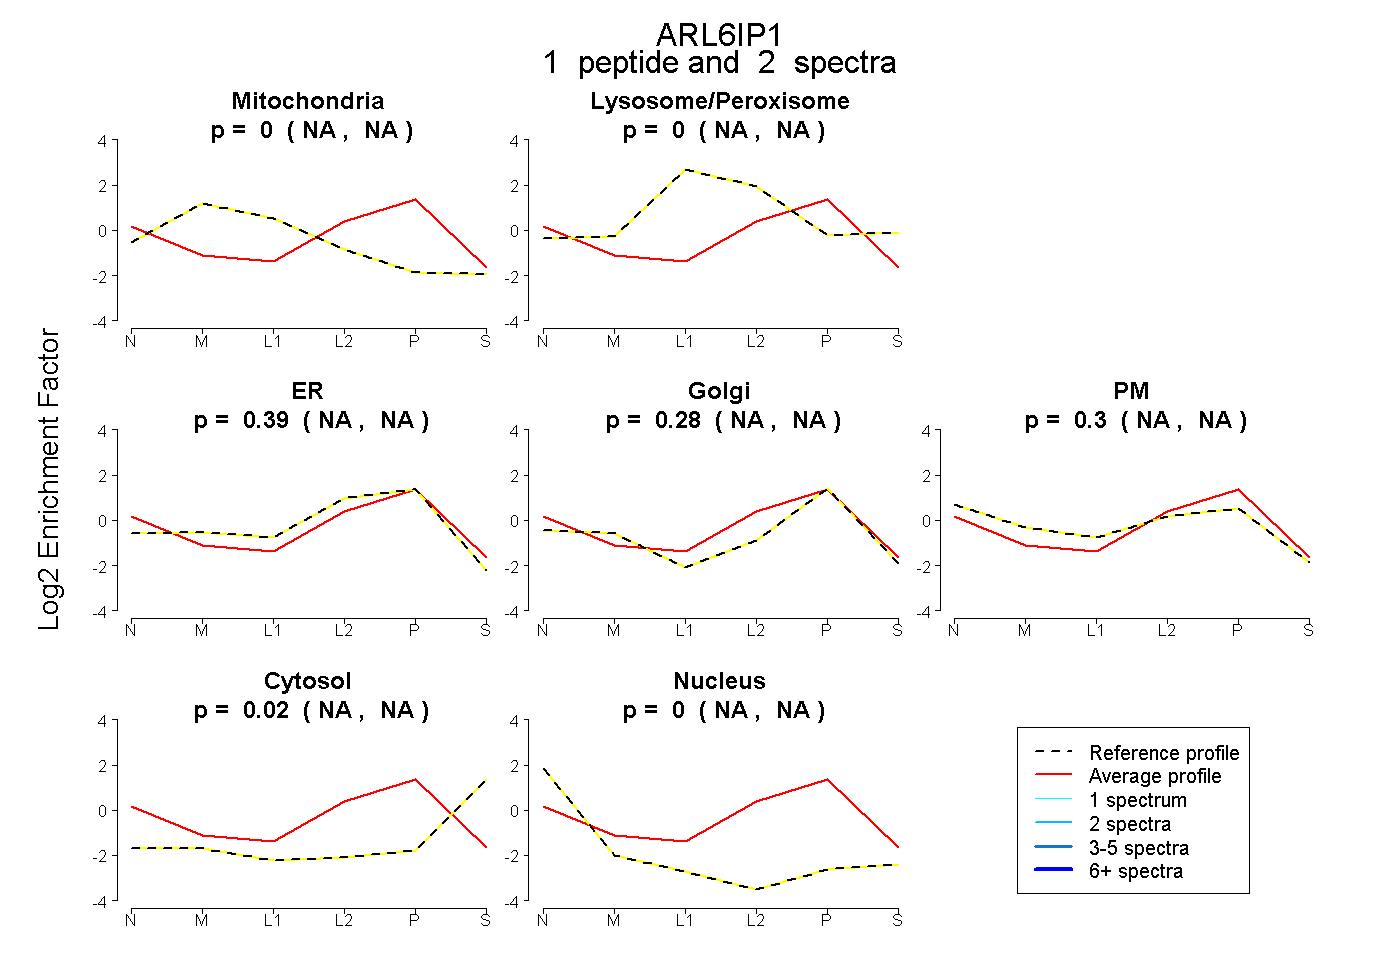
NA | NA
NA | NA
NA | NA
NA | NA
NA | NA
NA | NA
NA | NA
5peptides
spectra
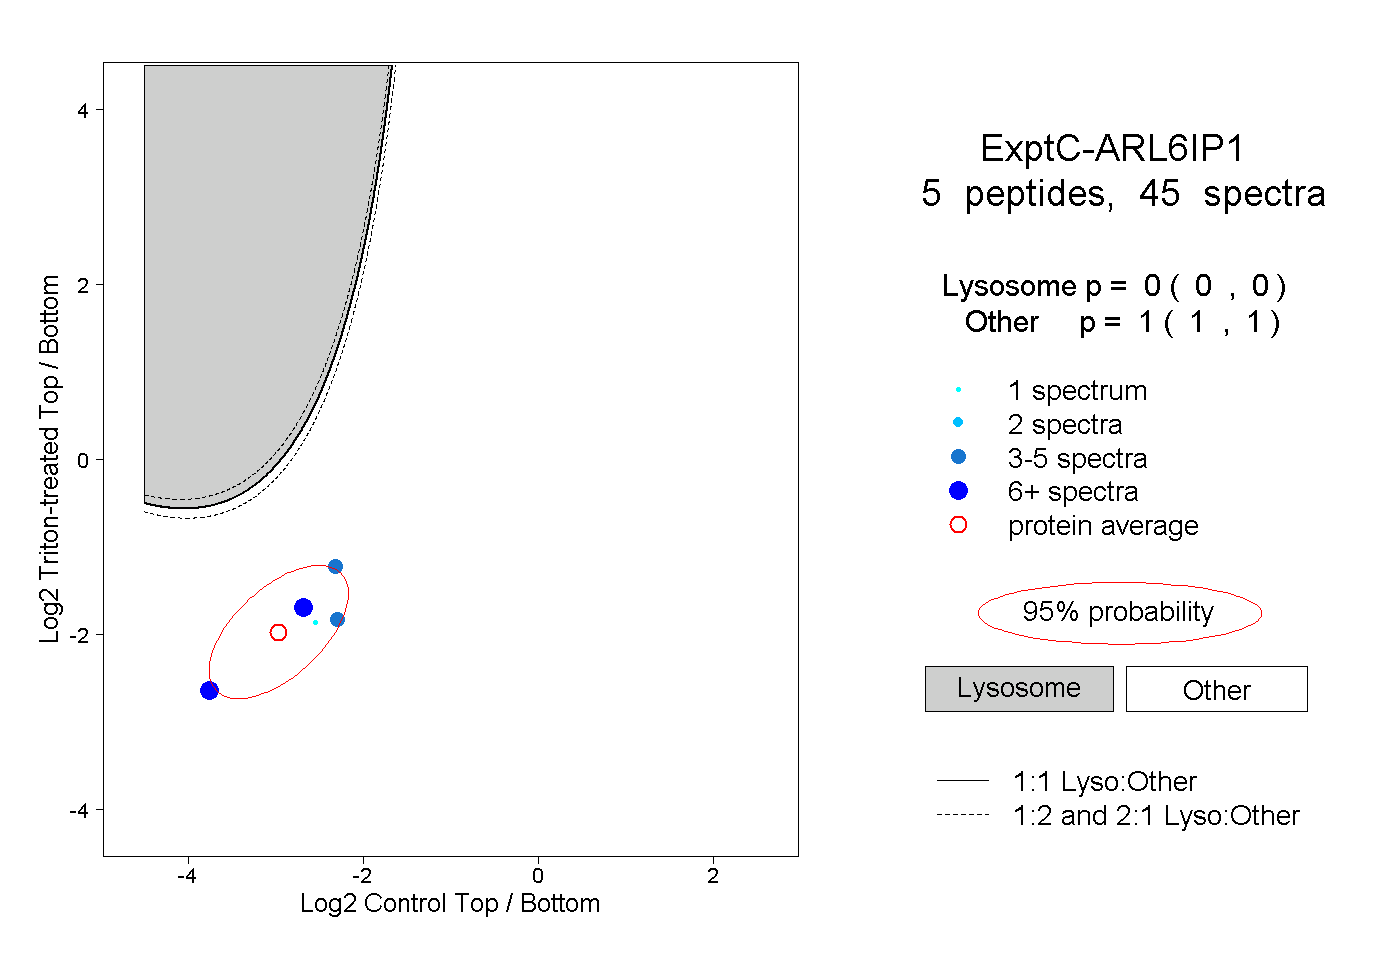
0.000 | 0.000
1.000 | 1.000
1peptide
spectrum
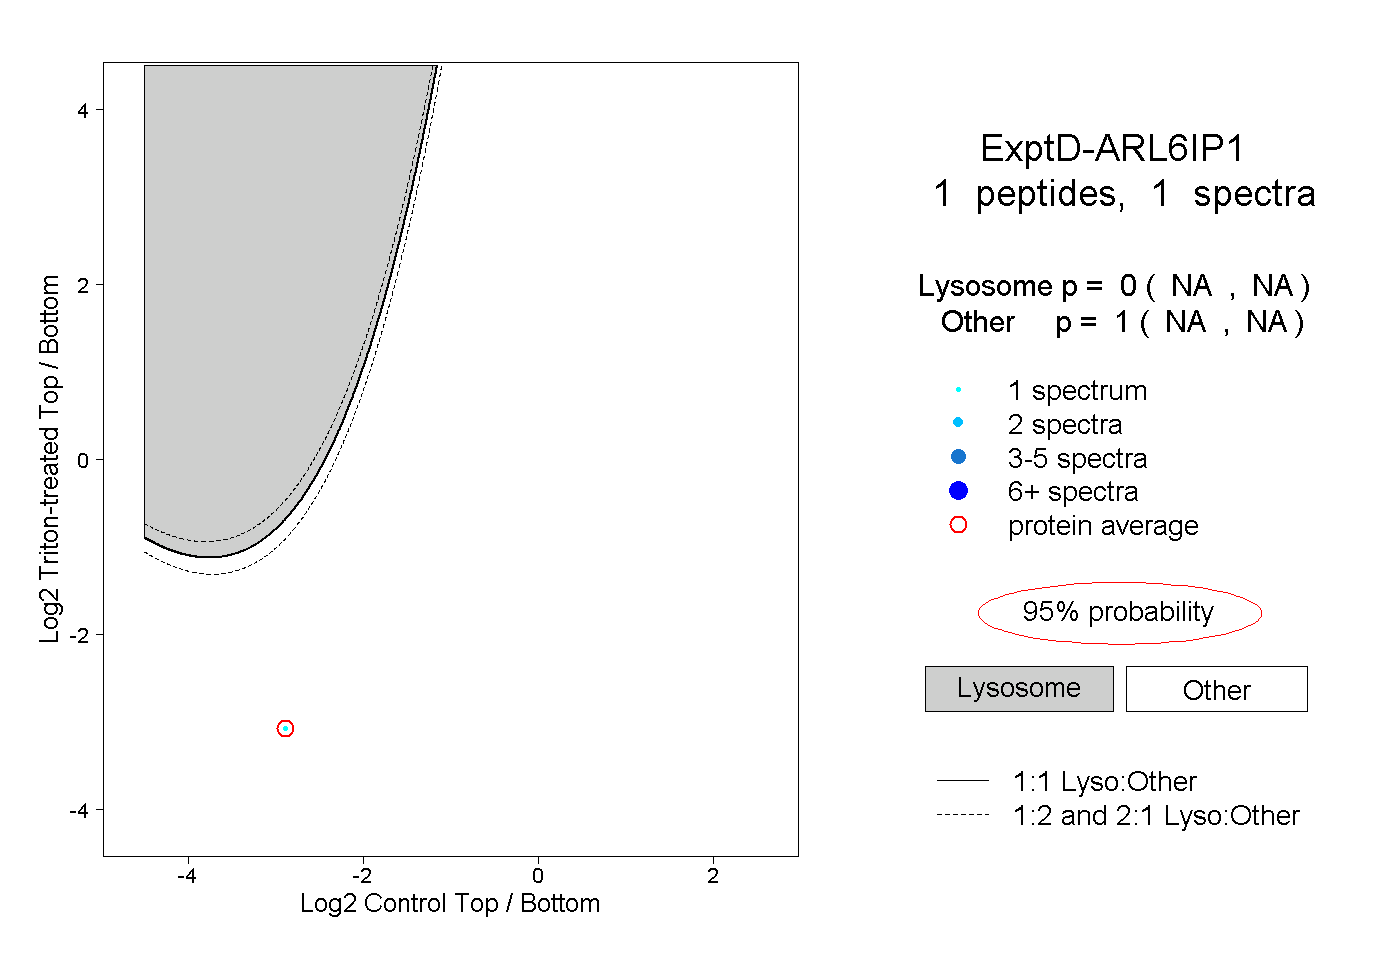
NA | NA
NA | NA