11
11peptides
spectra
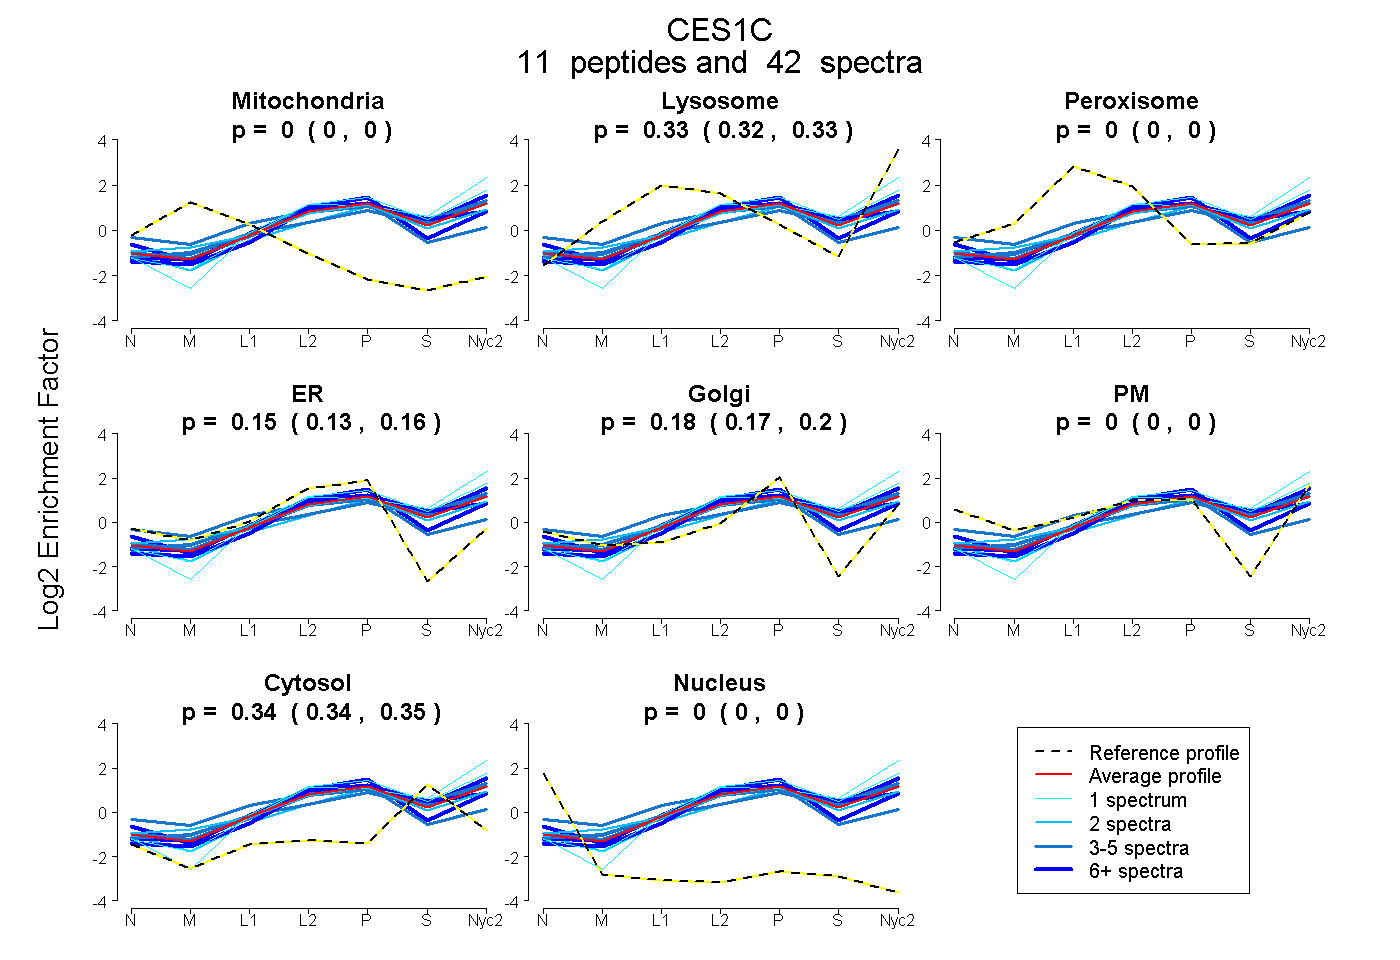
0.000 | 0.000
0.319 | 0.333
0.000 | 0.000
0.131 | 0.163
0.166 | 0.195
0.000 | 0.000
0.337 | 0.347
0.000 | 0.000
7peptides
spectra
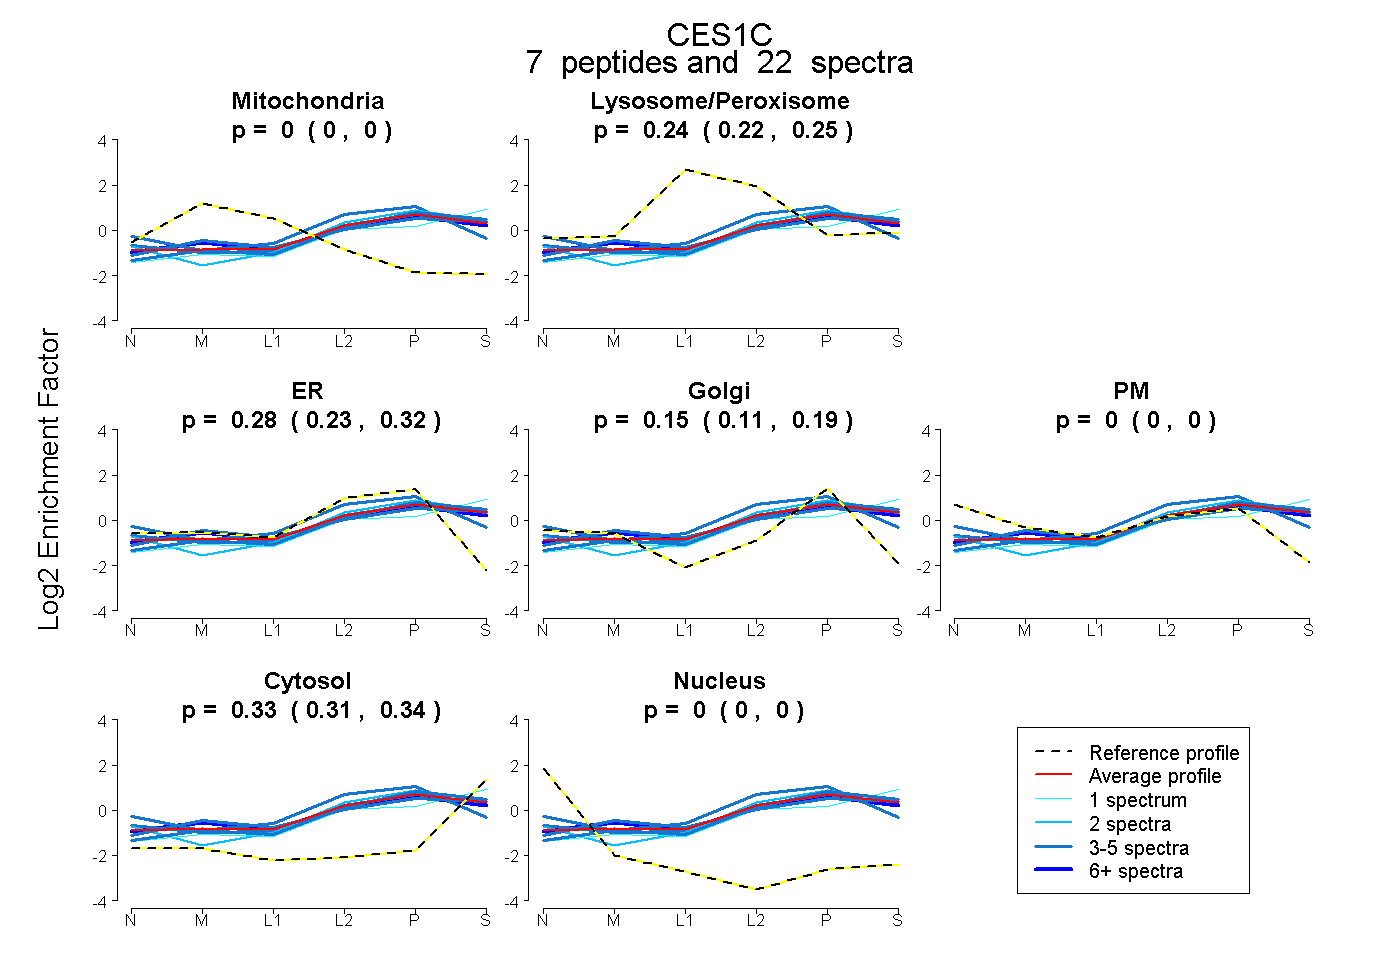
0.000 | 0.000
0.218 | 0.254
0.228 | 0.322
0.107 | 0.192
0.000 | 0.000
0.313 | 0.342
0.000 | 0.000
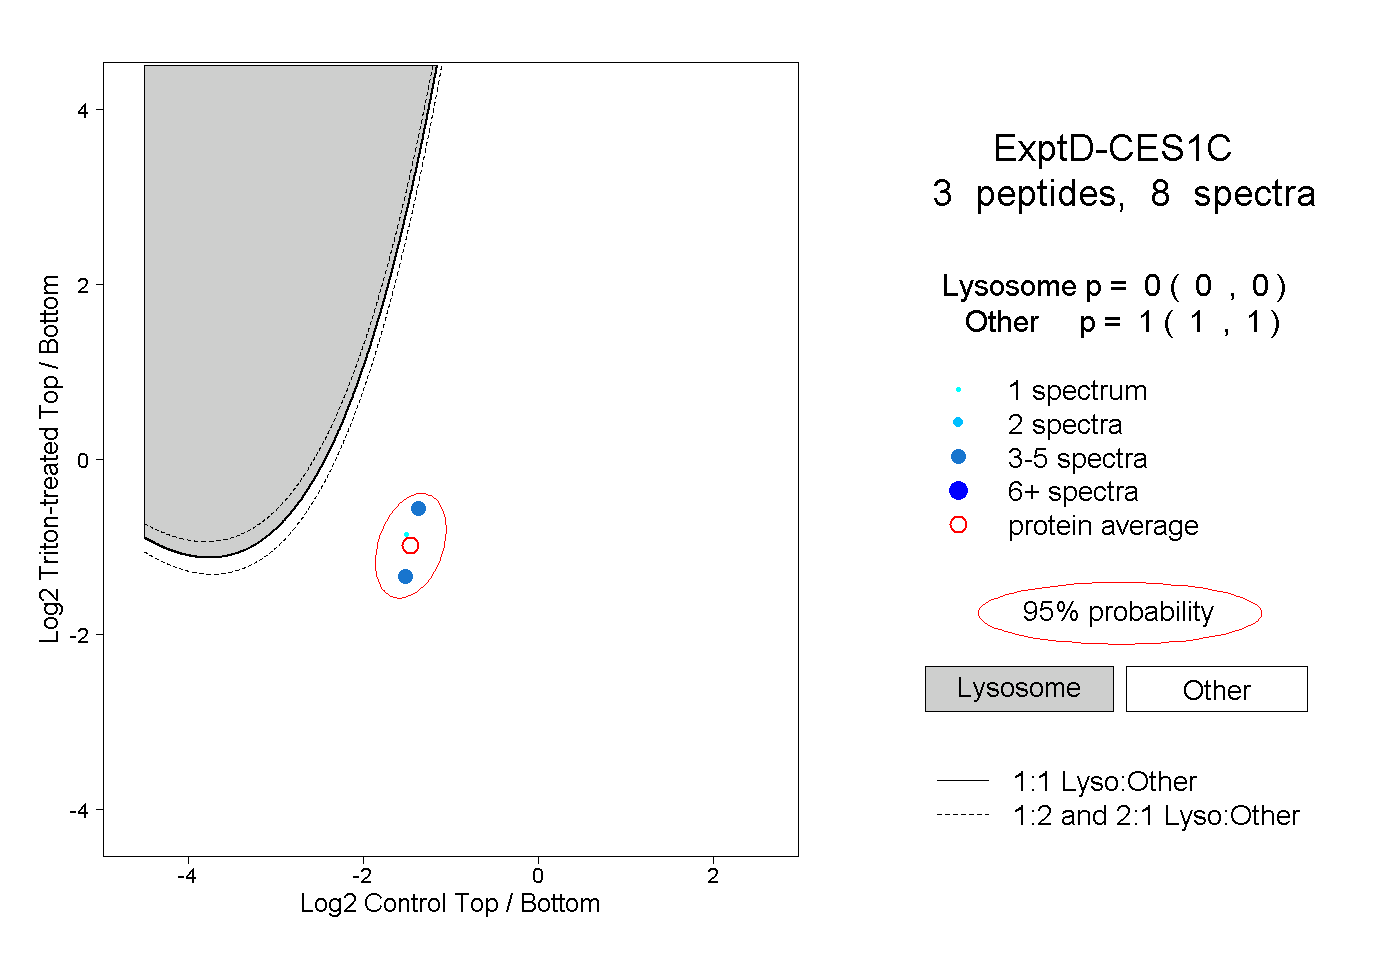
10peptides
spectra
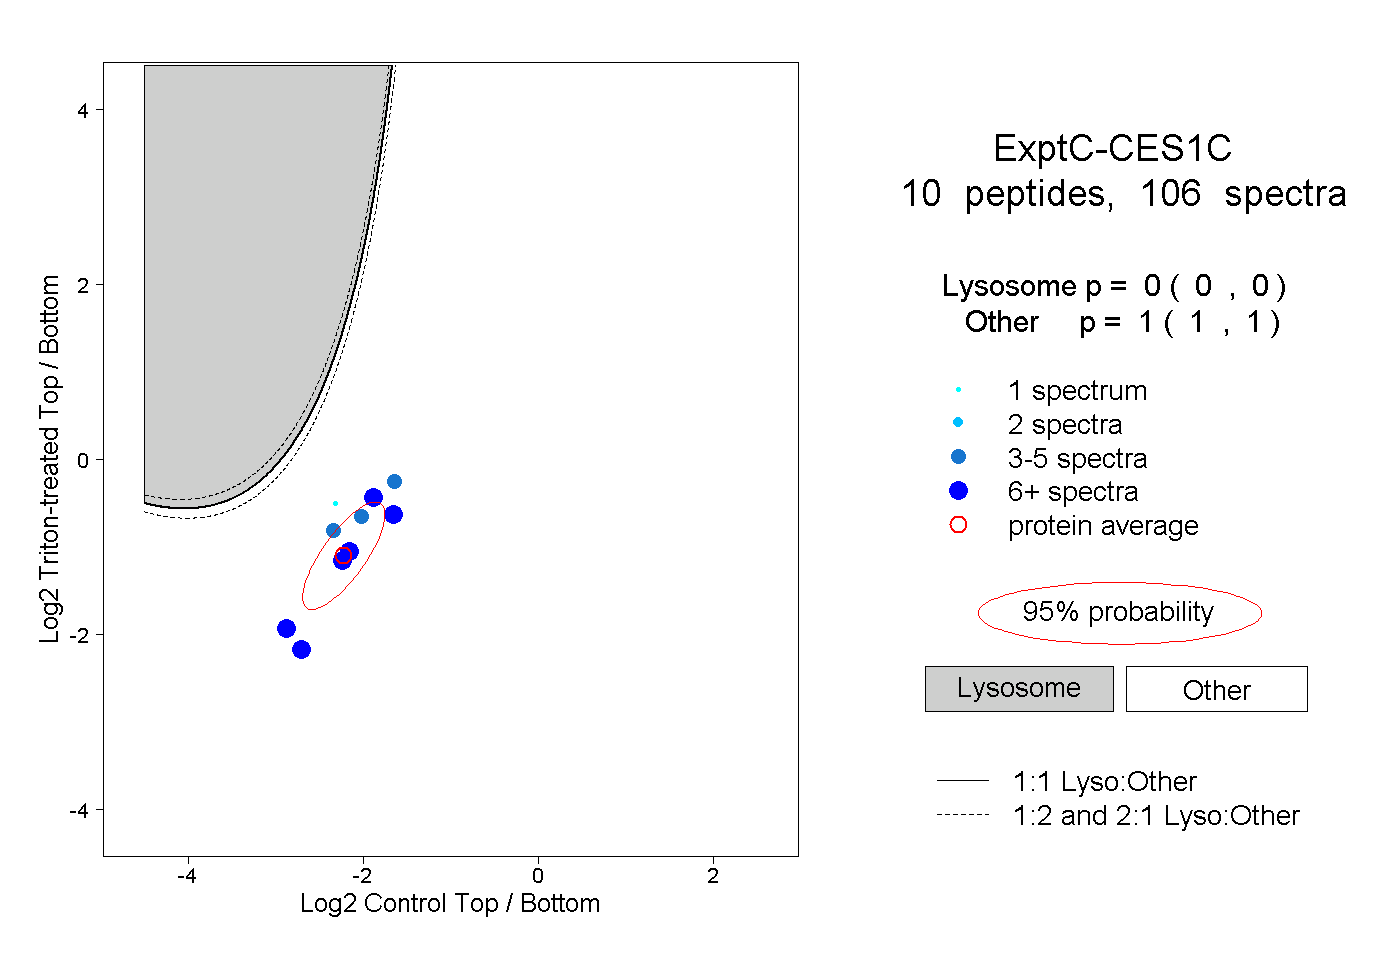
0.000 | 0.000
1.000 | 1.000