 11
11peptides
spectra
0.000 | 0.000
0.319 | 0.333
0.000 | 0.000
0.131 | 0.163
0.166 | 0.195
0.000 | 0.000
0.337 | 0.347
0.000 | 0.000
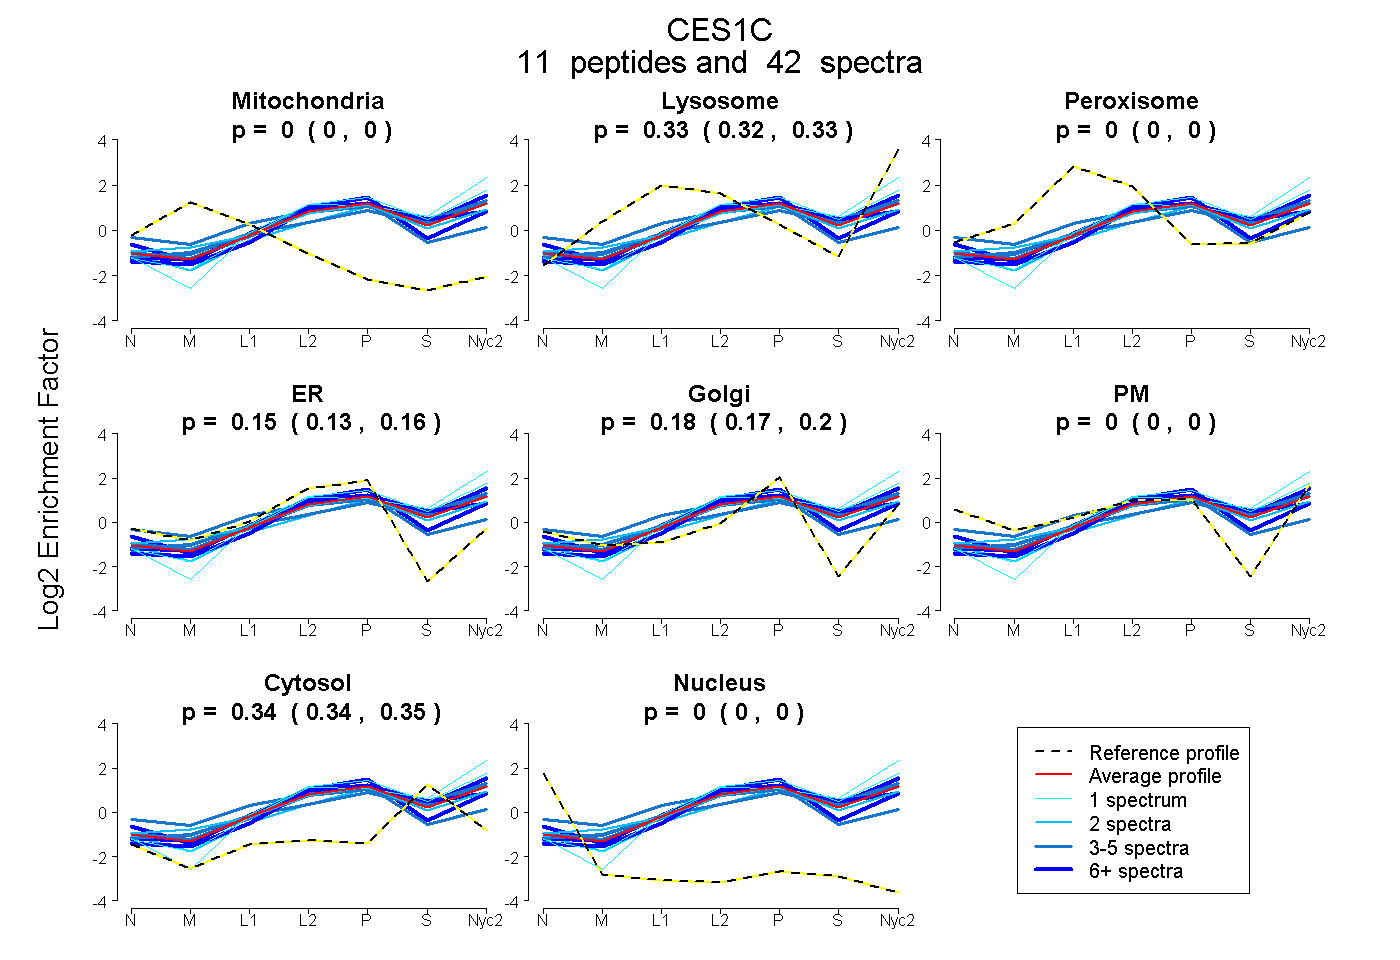
| Plot | Mito | Lyso | Perox | ER | Golgi | PM | Cytosol | Nucleus | |||||
| Expt A |
11 peptides |
42 spectra |
|
0.000 0.000 | 0.000 |
0.326 0.319 | 0.333 |
0.000 0.000 | 0.000 |
0.149 0.131 | 0.163 |
0.182 0.166 | 0.195 |
0.000 0.000 | 0.000 |
0.343 0.337 | 0.347 |
0.000 0.000 | 0.000 |
| 8 spectra, NPPQTEHTEHT | 0.000 | 0.272 | 0.000 | 0.233 | 0.081 | 0.000 | 0.415 | 0.000 | ||
| 1 spectrum, TEAELLELTVK | 0.000 | 0.362 | 0.000 | 0.060 | 0.220 | 0.000 | 0.359 | 0.000 | ||
| 3 spectra, GEEVAFWTELLAK | 0.000 | 0.400 | 0.000 | 0.000 | 0.237 | 0.000 | 0.363 | 0.000 | ||
| 1 spectrum, QEFGWIIPTMMGNLLSEGR | 0.000 | 0.486 | 0.000 | 0.000 | 0.172 | 0.000 | 0.342 | 0.000 | ||
| 3 spectra, EGYLQIGATTQQAQK | 0.000 | 0.000 | 0.293 | 0.282 | 0.238 | 0.000 | 0.188 | 0.000 | ||
| 2 spectra, AISESGVVLTTNLDK | 0.000 | 0.289 | 0.000 | 0.000 | 0.288 | 0.000 | 0.424 | 0.000 | ||
| 8 spectra, EGASEEETNLSK | 0.000 | 0.226 | 0.000 | 0.364 | 0.146 | 0.000 | 0.264 | 0.000 | ||
| 3 spectra, LLADMLSTGK | 0.000 | 0.367 | 0.000 | 0.149 | 0.132 | 0.000 | 0.351 | 0.000 | ||
| 6 spectra, GNWAHLDQLAALR | 0.000 | 0.392 | 0.000 | 0.029 | 0.242 | 0.000 | 0.336 | 0.000 | ||
| 5 spectra, GTHDPAK | 0.000 | 0.358 | 0.000 | 0.078 | 0.195 | 0.000 | 0.368 | 0.000 | ||
| 2 spectra, SFNTVPYIVGFNK | 0.000 | 0.311 | 0.000 | 0.208 | 0.156 | 0.000 | 0.326 | 0.000 |
| Plot | Mito | Lyso or Perox | ER | Golgi | PM | Cytosol | Nucleus | ||||||
| Expt B |
7 peptides |
22 spectra |
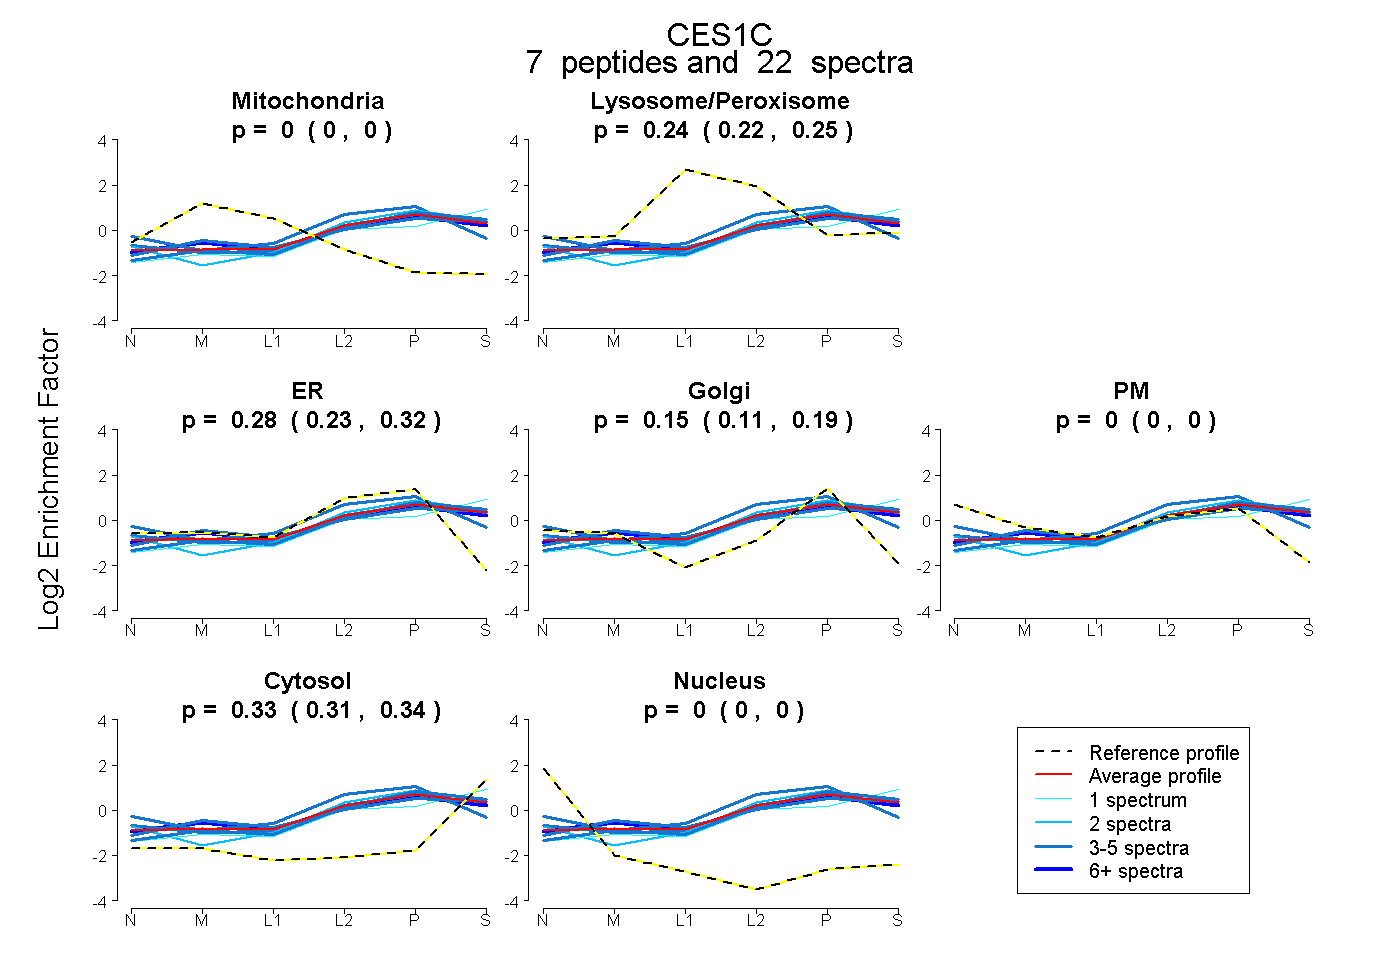 |
0.000 0.000 | 0.000 |
0.238 0.218 | 0.254 |
0.280 0.228 | 0.322 |
0.153 0.107 | 0.192 |
0.000 0.000 | 0.000 |
0.329 0.313 | 0.342 |
0.000 0.000 | 0.000 |
|||
| Plot | Lyso | Other | |||||||||||
| Expt C |
10 peptides |
106 spectra |
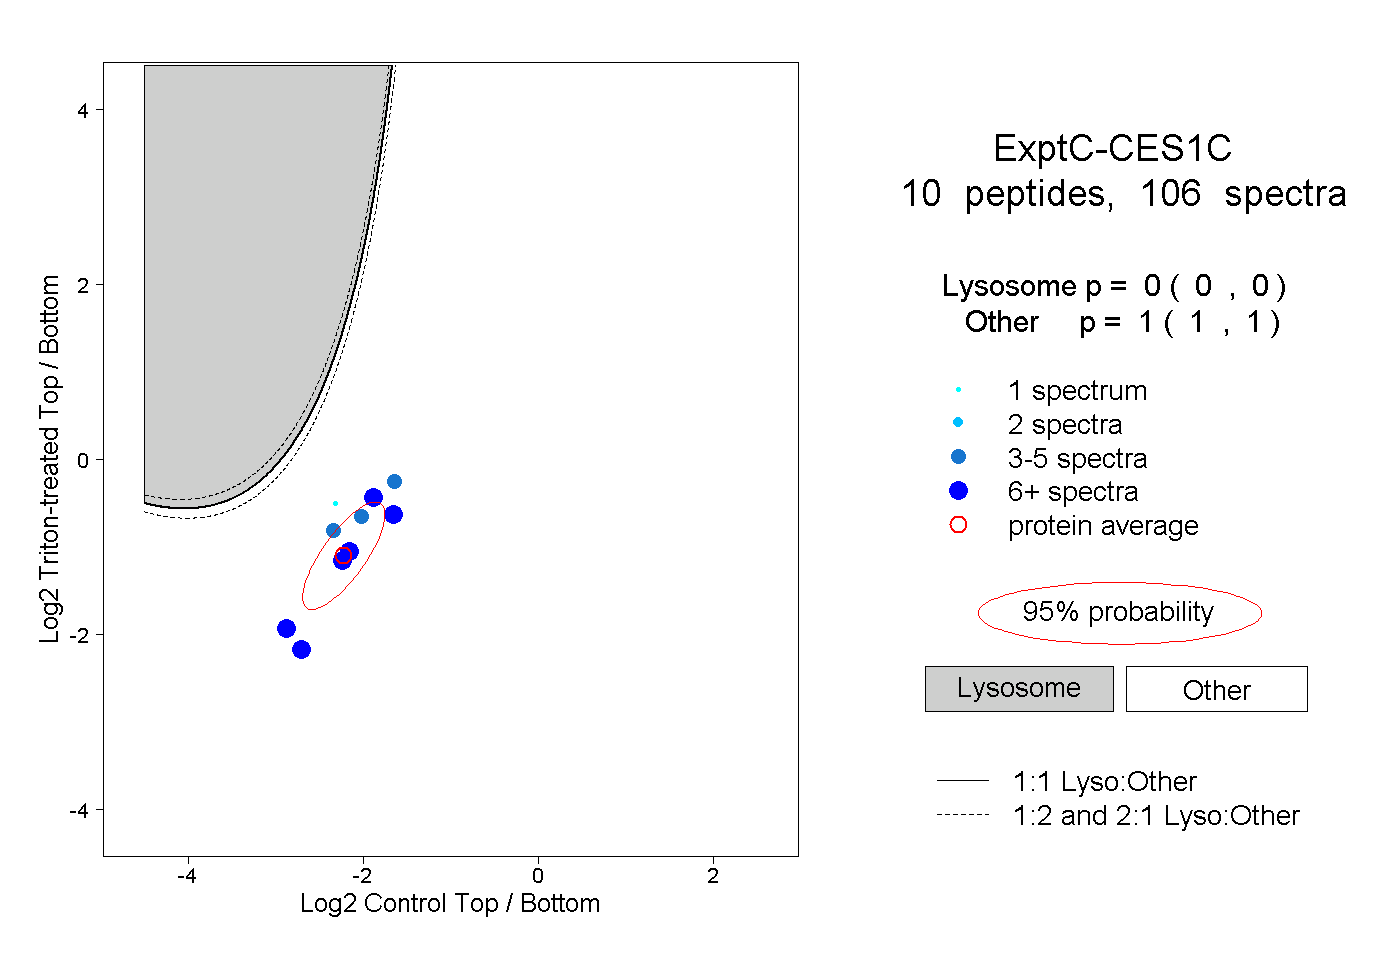 |
0.000 0.000 | 0.000 |
1.000 1.000 | 1.000 |
||||||||
| Plot | Lyso | Other | |||||||||||
| Expt D |
3 peptides |
8 spectra |
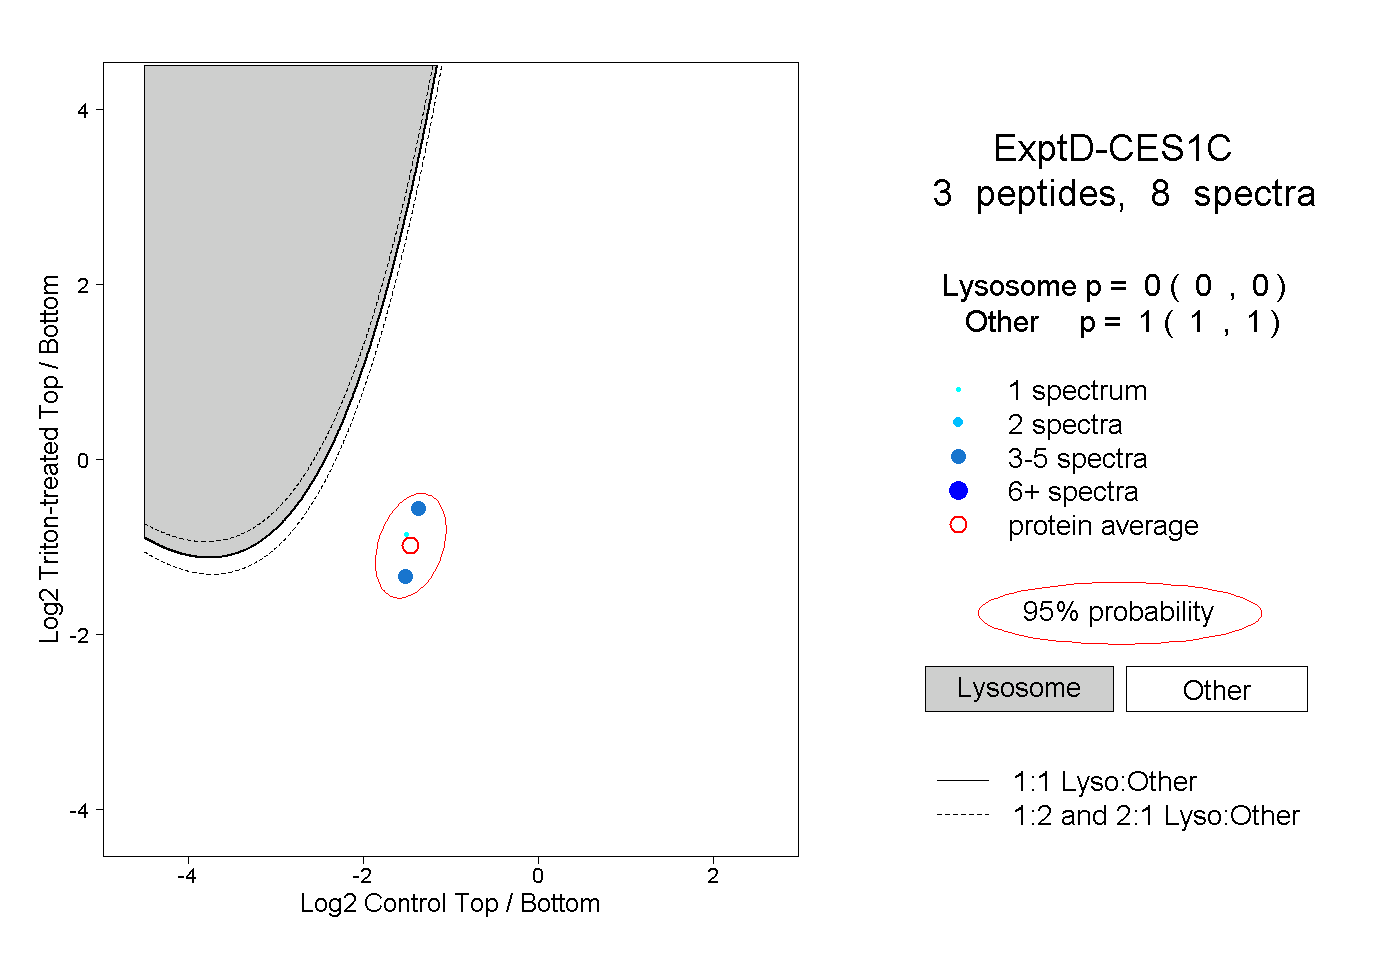 |
0.000 0.000 | 0.000 |
1.000 1.000 | 1.000 |