 2
2peptides
spectra
0.000 | 0.000
0.270 | 0.308
0.000 | 0.000
0.000 | 0.000
0.403 | 0.451
0.127 | 0.178
0.105 | 0.142
0.000 | 0.000
3peptides
spectra
0.000 | 0.018
0.982 | 1.000
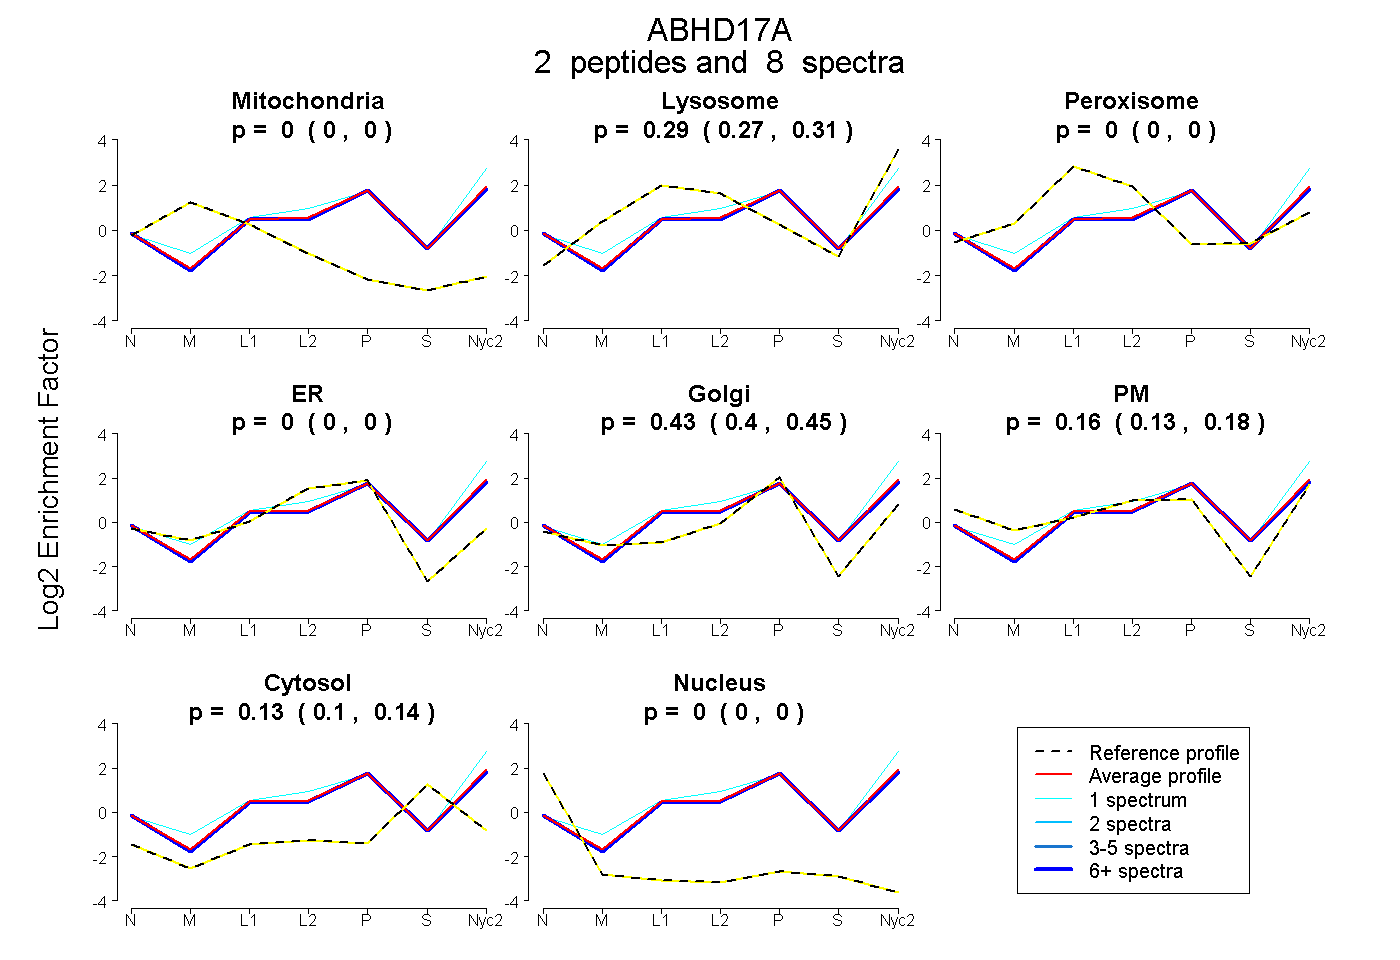
| Plot | Mito | Lyso | Perox | ER | Golgi | PM | Cytosol | Nucleus | |||||
| Expt A |
2 peptides |
8 spectra |
|
0.000 0.000 | 0.000 |
0.291 0.270 | 0.308 |
0.000 0.000 | 0.000 |
0.000 0.000 | 0.000 |
0.429 0.403 | 0.451 |
0.155 0.127 | 0.178 |
0.125 0.105 | 0.142 |
0.000 0.000 | 0.000 |
||
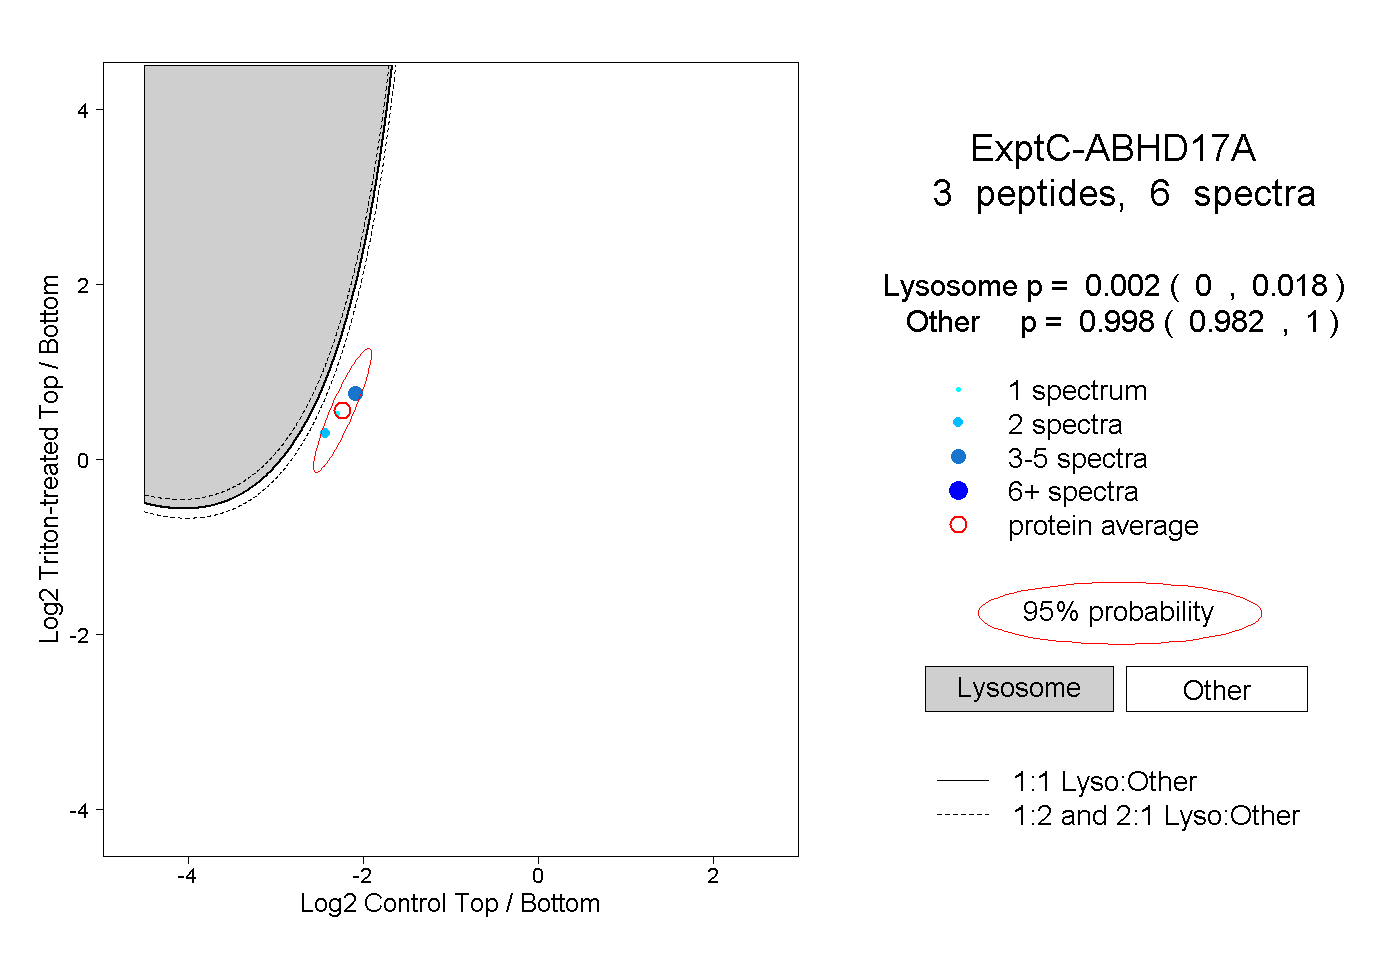
| Plot | Lyso | Other | |||||||||||
| Expt C |
3 peptides |
6 spectra |
|
0.002 0.000 | 0.018 |
0.998 0.982 | 1.000 |
| 1 spectrum, IACMYVR | 0.005 | 0.995 | ||||||||
| 2 spectra, FISQELPSQR | 0.010 | 0.990 | ||||||||
| 3 spectra, ADFQYGQR | 0.000 | 1.000 |