 21
21peptides
spectra
0.000 | 0.000
0.000 | 0.000
0.000 | 0.000
0.056 | 0.083
0.000 | 0.015
0.000 | 0.000
0.176 | 0.191
0.731 | 0.746
2peptides
spectra
NA | NA
NA | NA
NA | NA
NA | NA
NA | NA
NA | NA
NA | NA
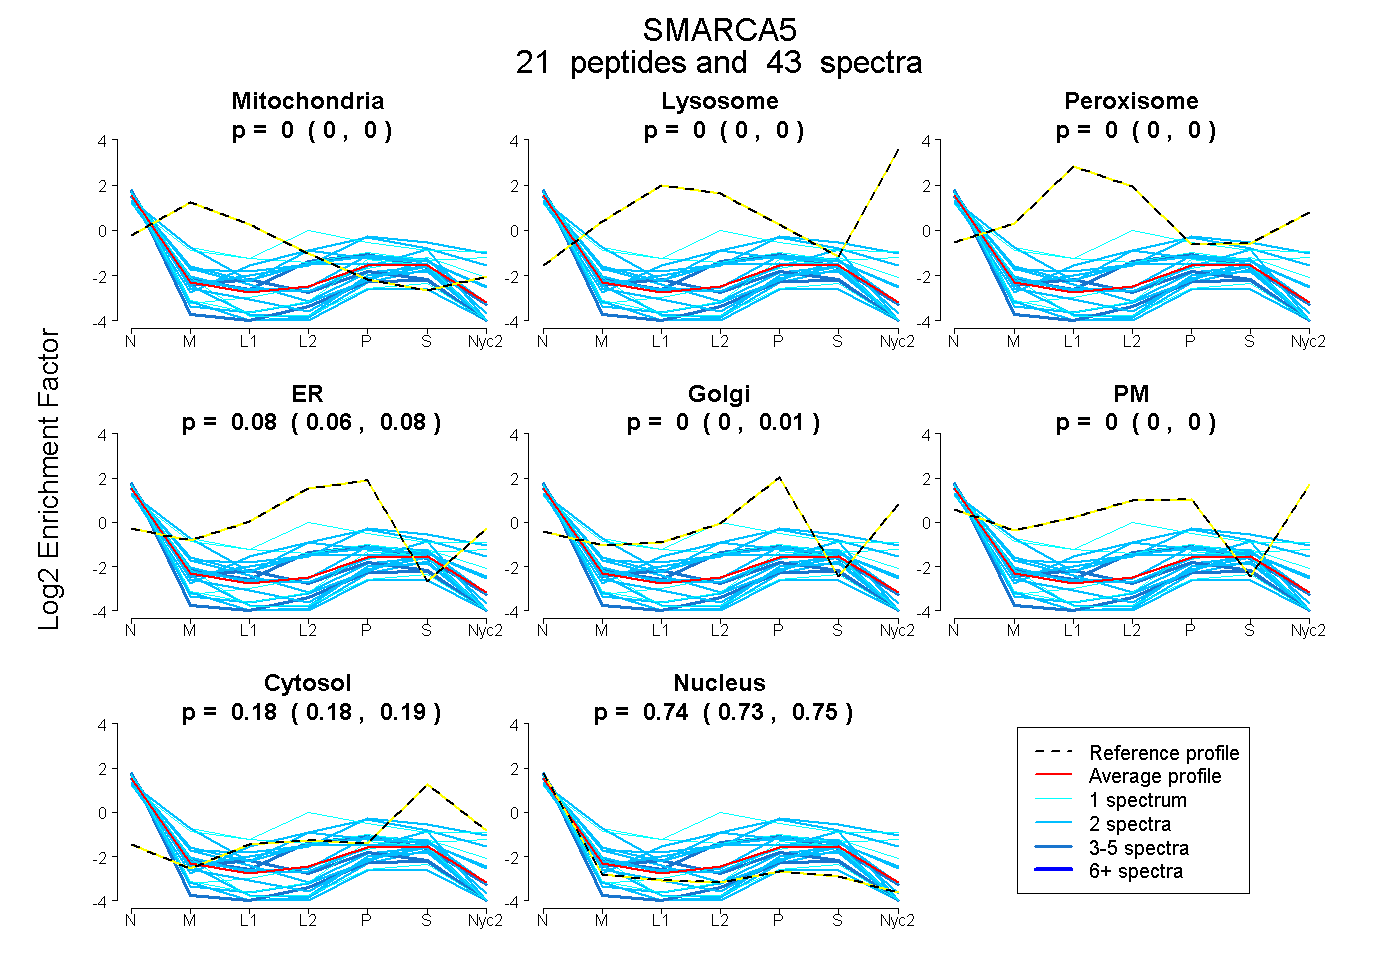
| Plot | Mito | Lyso | Perox | ER | Golgi | PM | Cytosol | Nucleus | |||||
| Expt A |
21 peptides |
43 spectra |
|
0.000 0.000 | 0.000 |
0.000 0.000 | 0.000 |
0.000 0.000 | 0.000 |
0.077 0.056 | 0.083 |
0.000 0.000 | 0.015 |
0.000 0.000 | 0.000 |
0.185 0.176 | 0.191 |
0.739 0.731 | 0.746 |
||
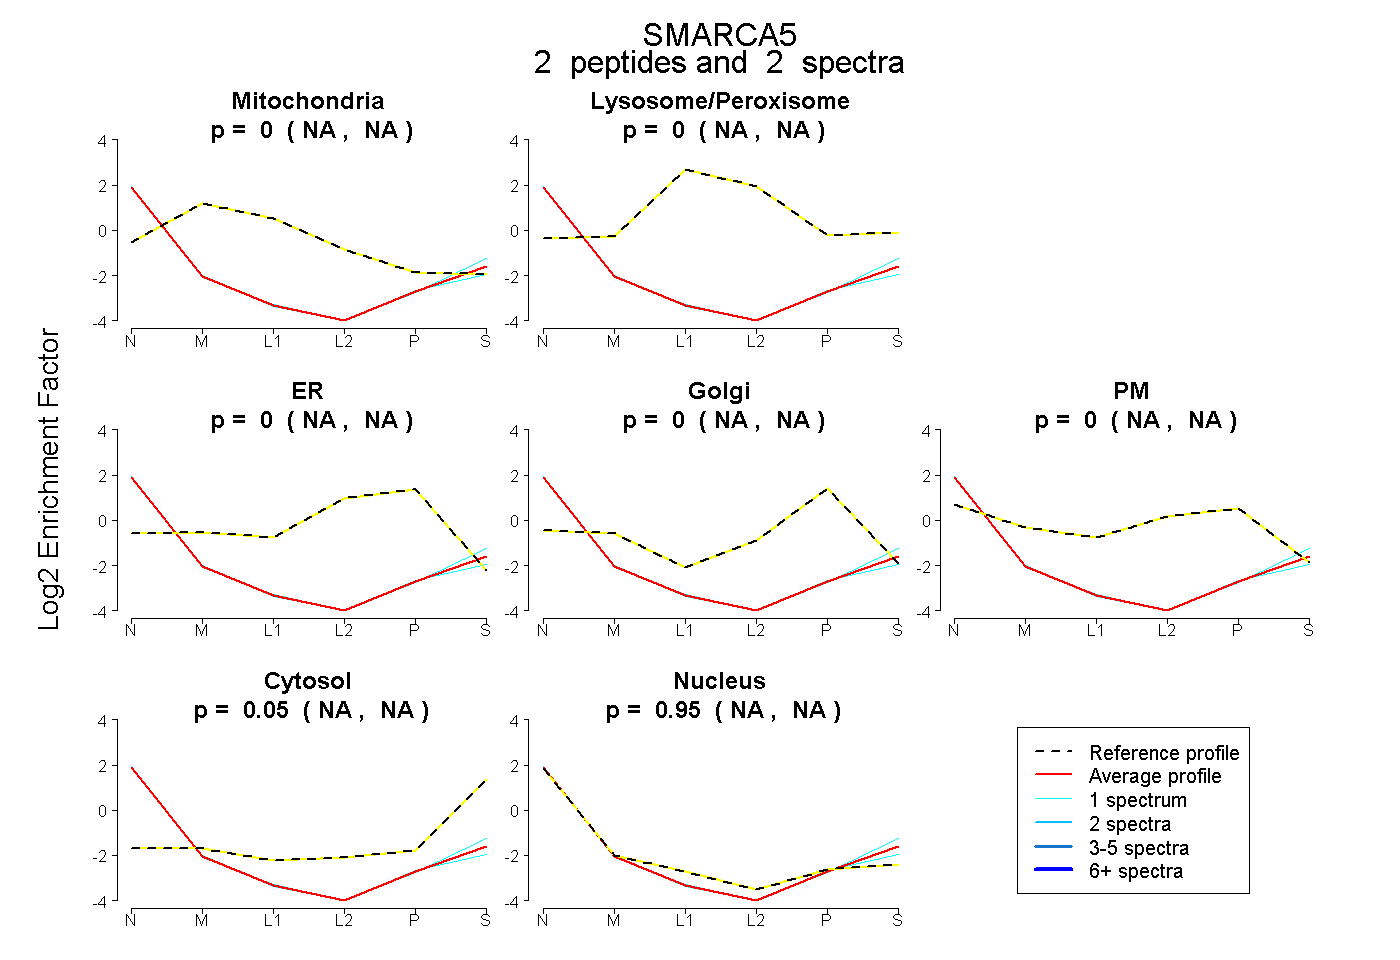
| Plot | Mito | Lyso or Perox | ER | Golgi | PM | Cytosol | Nucleus | ||||||
| Expt B |
2 peptides |
2 spectra |
|
0.000 NA | NA |
0.000 NA | NA |
0.000 NA | NA |
0.000 NA | NA |
0.000 NA | NA |
0.054 NA | NA |
0.946 NA | NA |