 5
5peptides
spectra
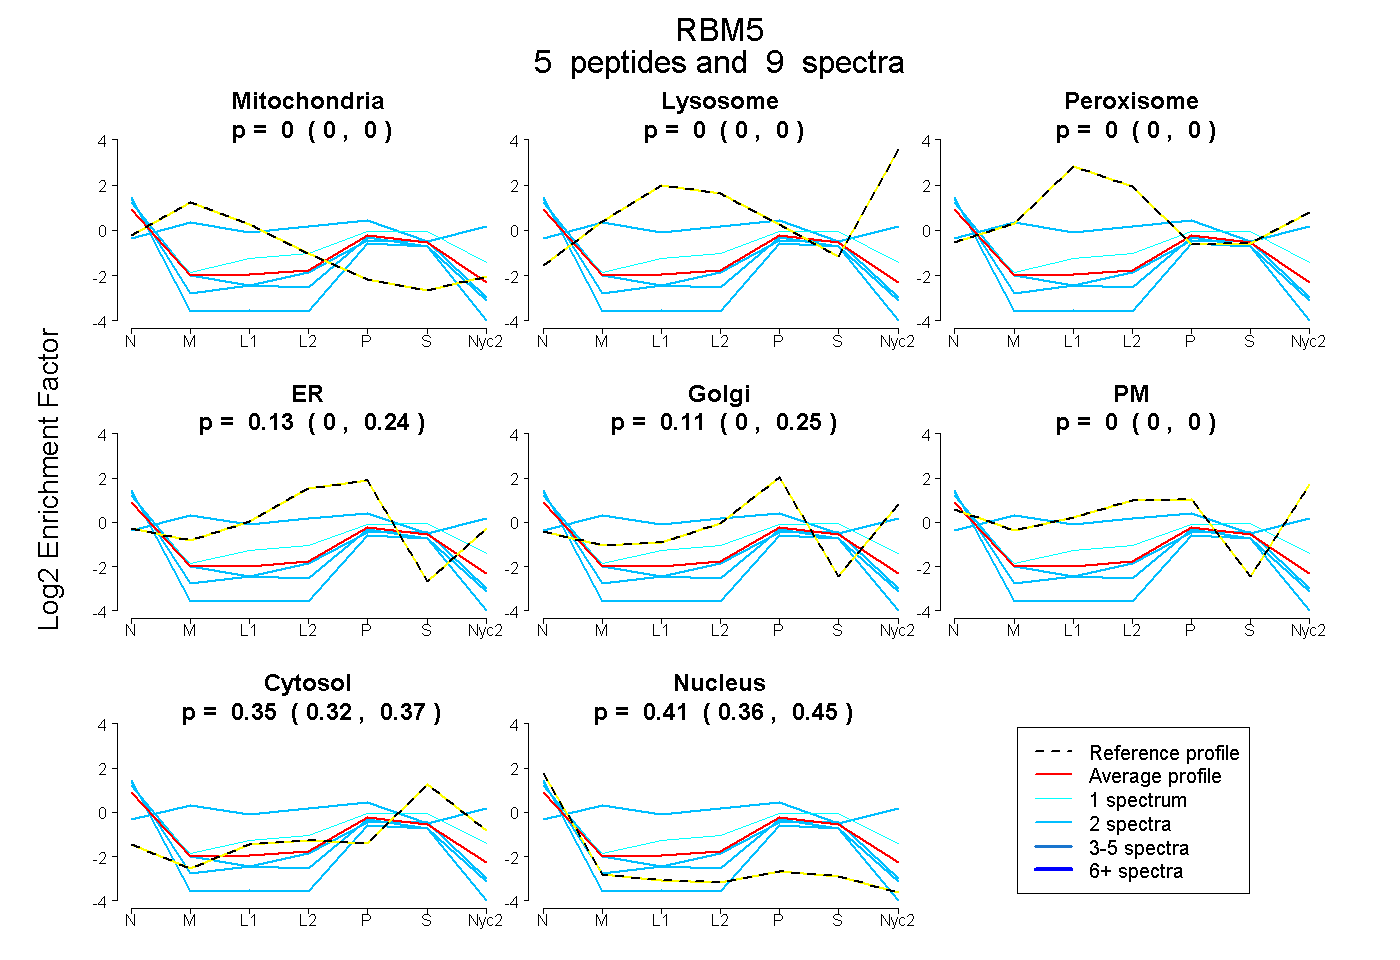
0.000 | 0.000
0.000 | 0.000
0.000 | 0.000
0.000 | 0.244
0.000 | 0.254
0.000 | 0.000
0.316 | 0.372
0.364 | 0.454
| Plot | Mito | Lyso | Perox | ER | Golgi | PM | Cytosol | Nucleus | |||||
| Expt A |
5 peptides |
9 spectra |
|
0.000 0.000 | 0.000 |
0.000 0.000 | 0.000 |
0.000 0.000 | 0.000 |
0.130 0.000 | 0.244 |
0.110 0.000 | 0.254 |
0.000 0.000 | 0.000 |
0.348 0.316 | 0.372 |
0.412 0.364 | 0.454 |
| 1 spectrum, LSEQELEALELR | 0.000 | 0.000 | 0.000 | 0.183 | 0.000 | 0.127 | 0.452 | 0.238 | ||
| 2 spectra, GAGLGAK | 0.137 | 0.023 | 0.285 | 0.000 | 0.366 | 0.008 | 0.180 | 0.000 | ||
| 2 spectra, HDISDER | 0.000 | 0.000 | 0.000 | 0.157 | 0.000 | 0.000 | 0.330 | 0.512 | ||
| 2 spectra, FEDWLCNK | 0.000 | 0.000 | 0.000 | 0.000 | 0.000 | 0.000 | 0.227 | 0.773 | ||
| 2 spectra, GLPITITESDIR | 0.000 | 0.000 | 0.000 | 0.000 | 0.123 | 0.000 | 0.285 | 0.592 |