 7
7peptides
spectra
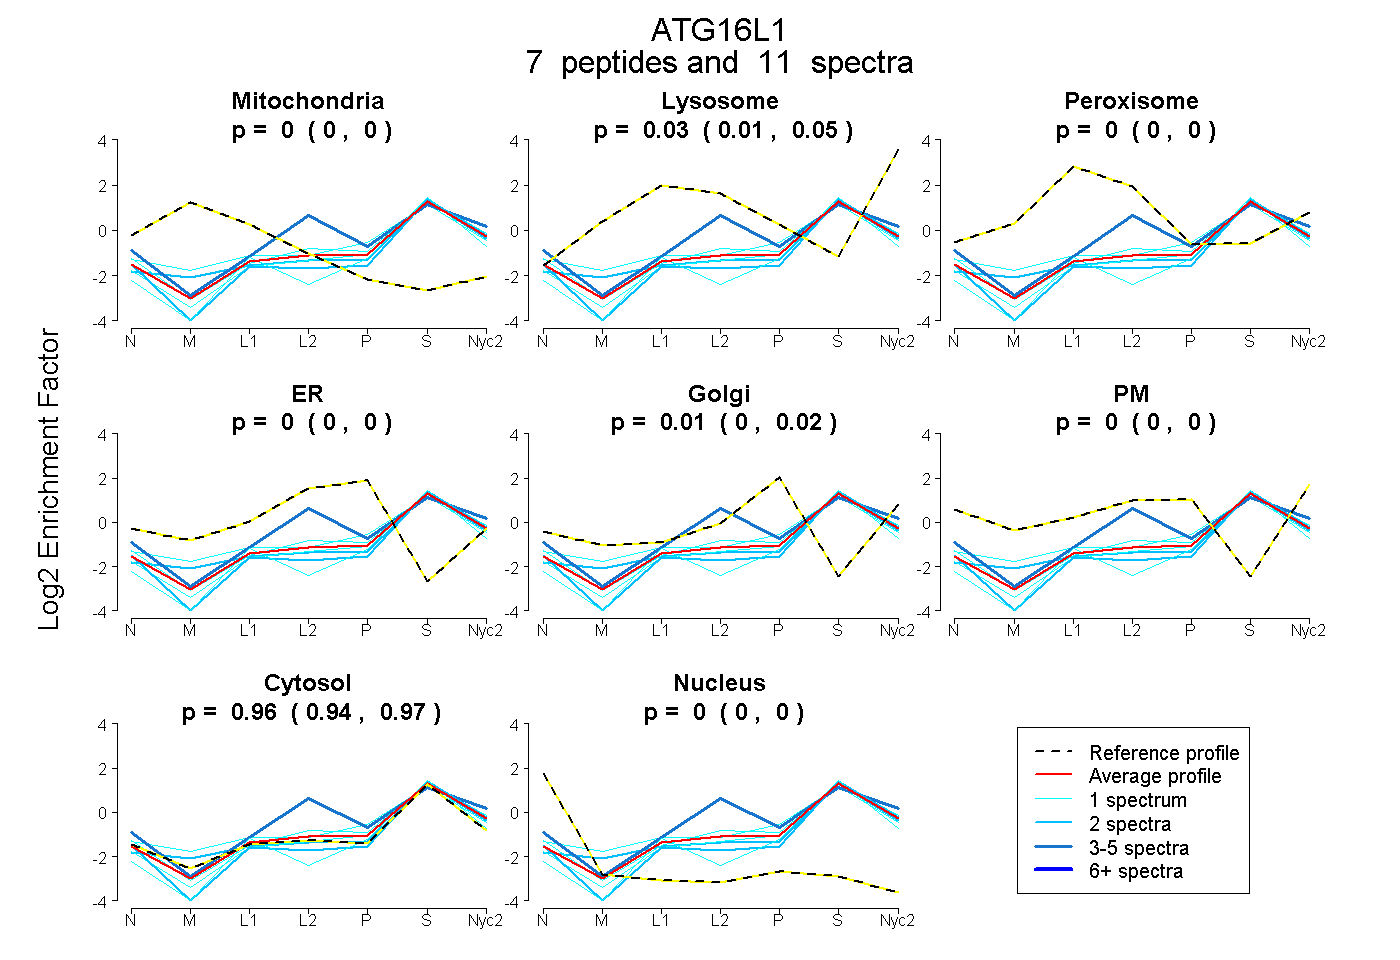
0.000 | 0.000
0.013 | 0.050
0.000 | 0.000
0.000 | 0.000
0.000 | 0.024
0.000 | 0.000
0.940 | 0.970
0.000 | 0.000
2peptides
spectra
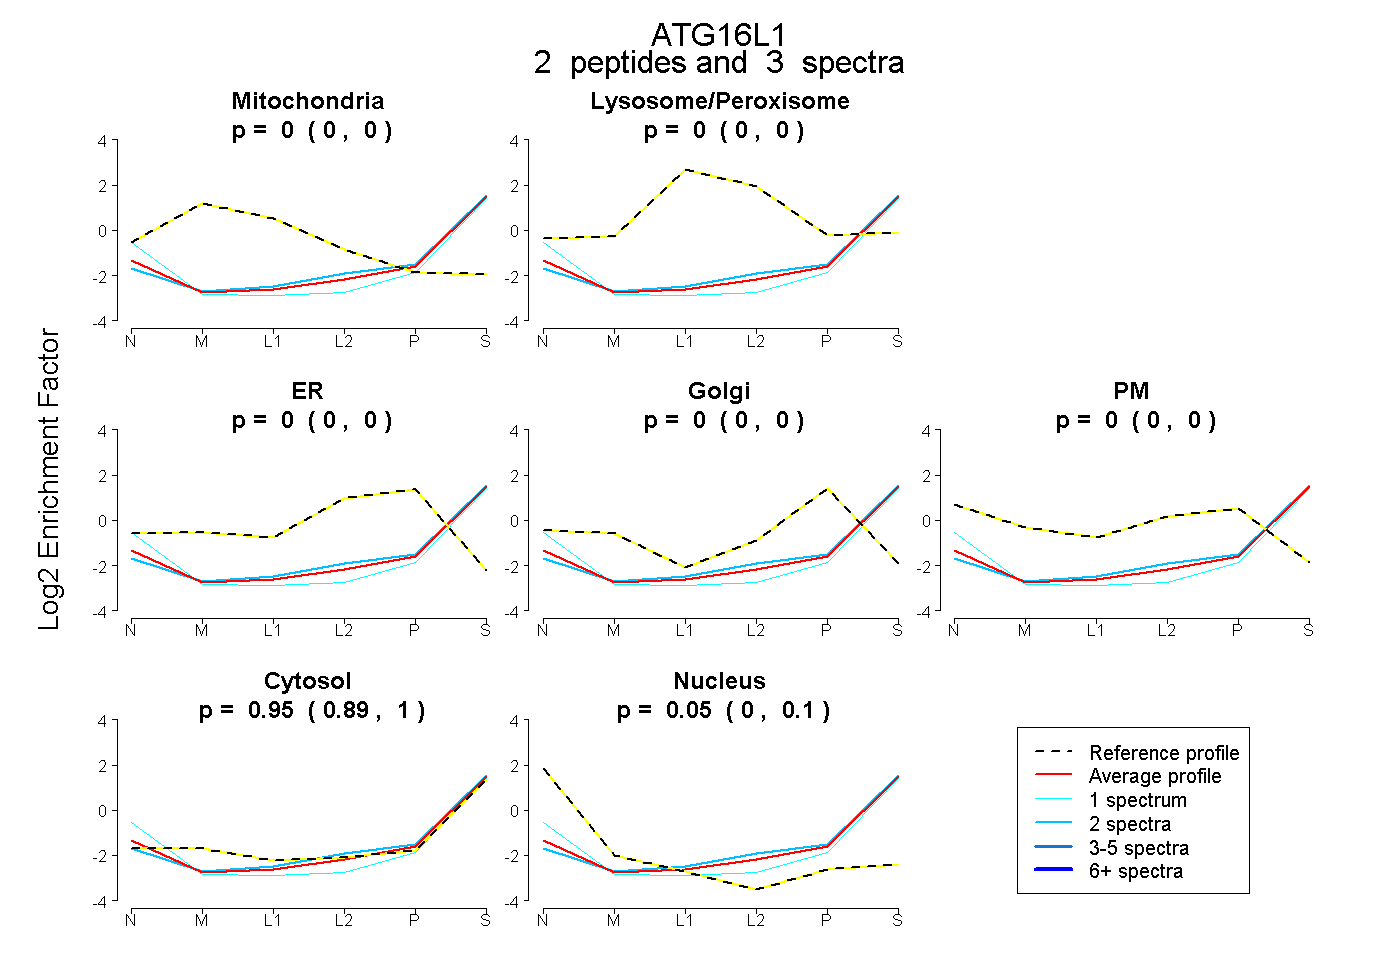
0.000 | 0.000
0.000 | 0.000
0.000 | 0.000
0.000 | 0.000
0.000 | 0.000
0.888 | 1.000
0.000 | 0.100
4peptides
spectra
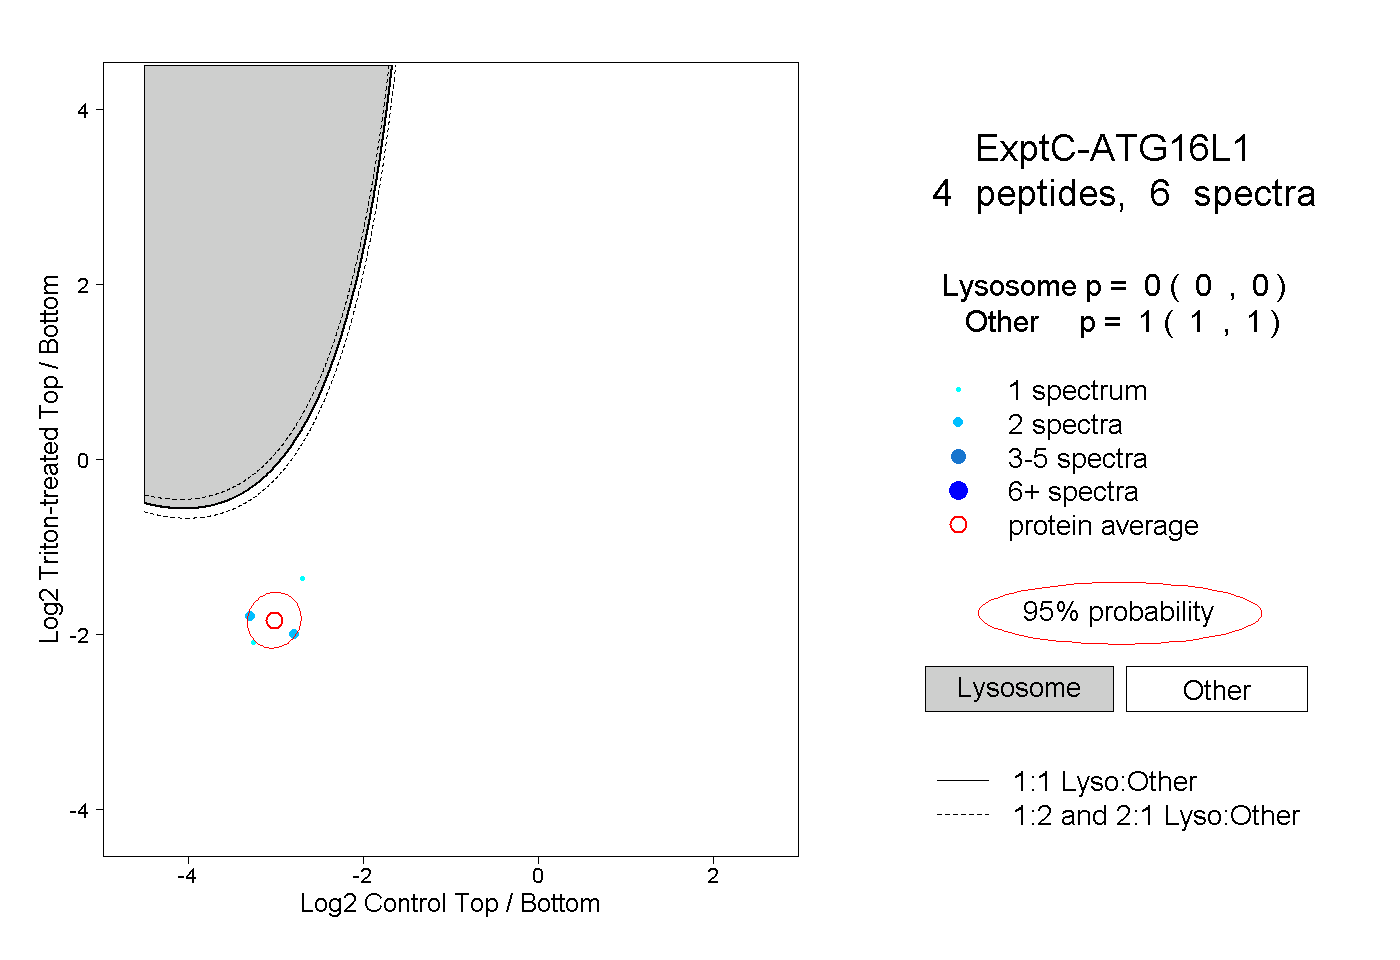
0.000 | 0.000
1.000 | 1.000