 35
35peptides
spectra
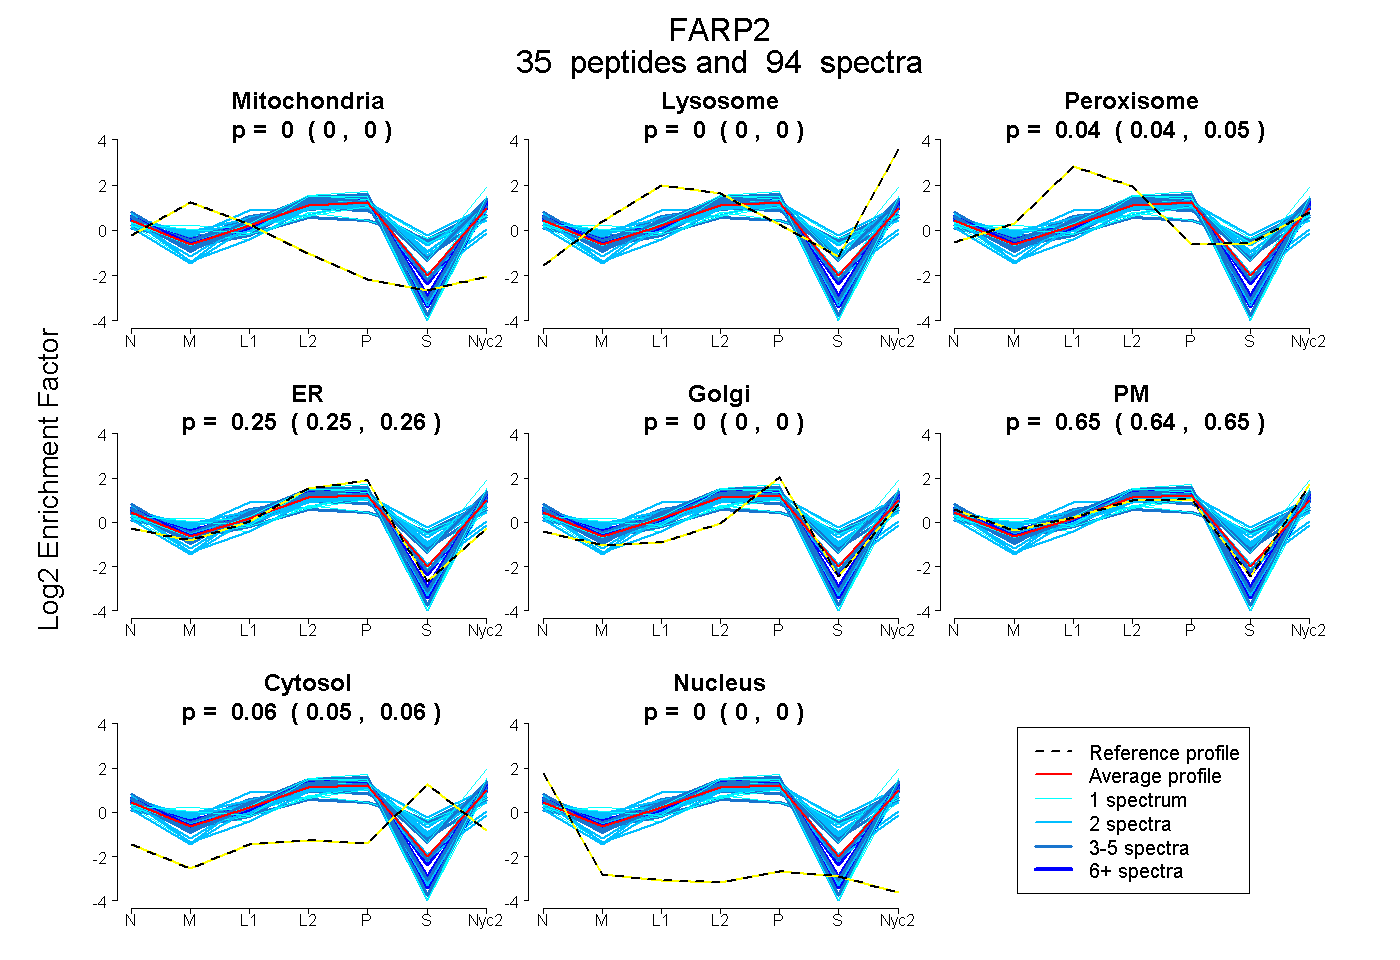
0.000 | 0.000
0.000 | 0.000
0.037 | 0.045
0.248 | 0.259
0.000 | 0.000
0.643 | 0.655
0.051 | 0.058
0.000 | 0.000
15peptides
spectra
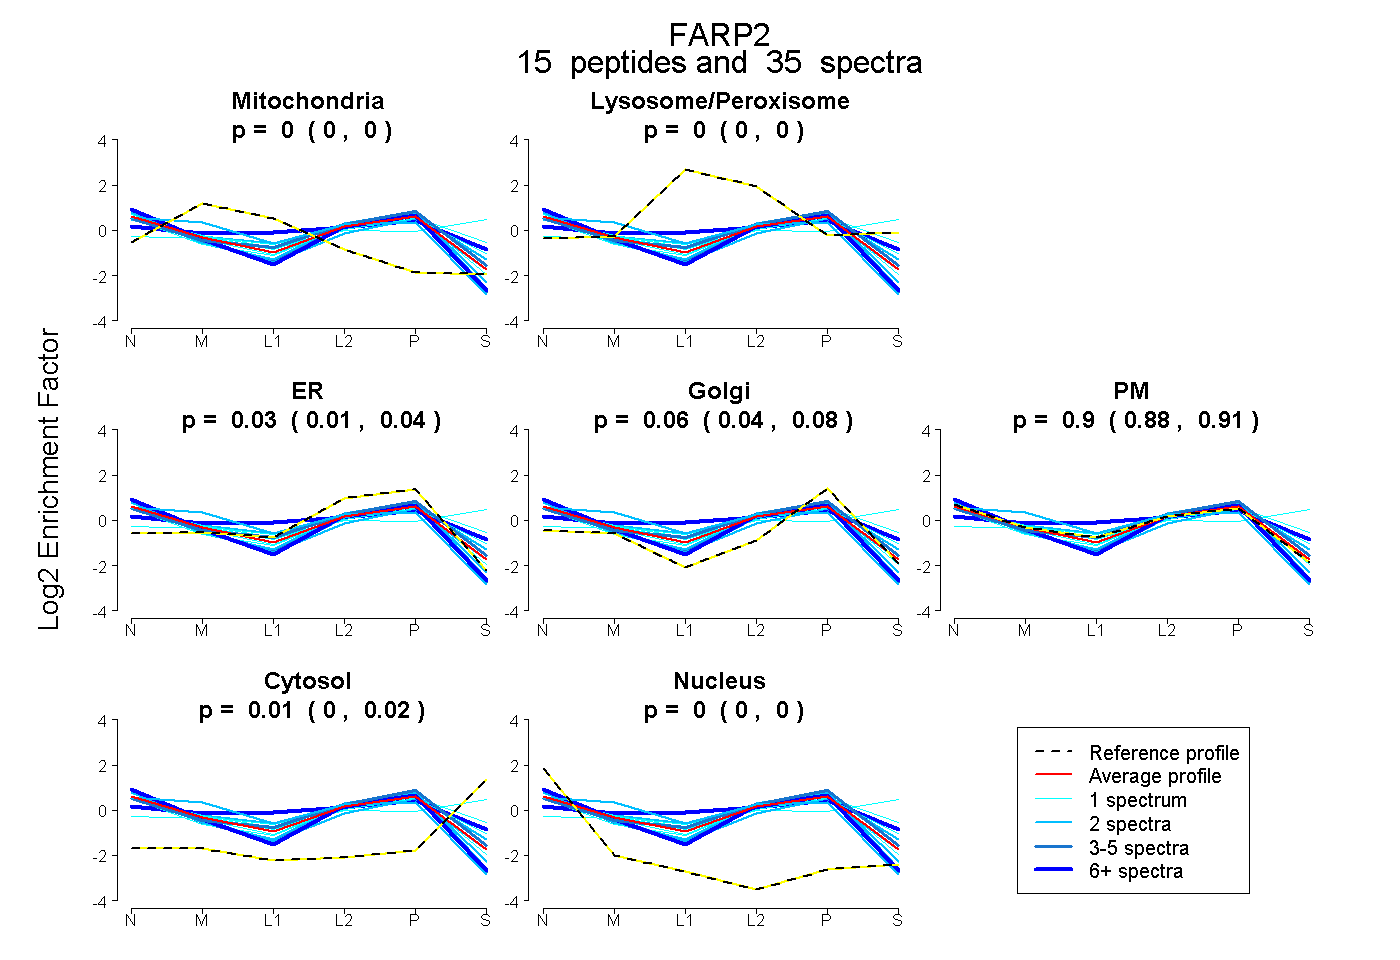
0.000 | 0.000
0.000 | 0.002
0.011 | 0.037
0.044 | 0.075
0.883 | 0.913
0.004 | 0.023
0.000 | 0.000
27peptides
spectra
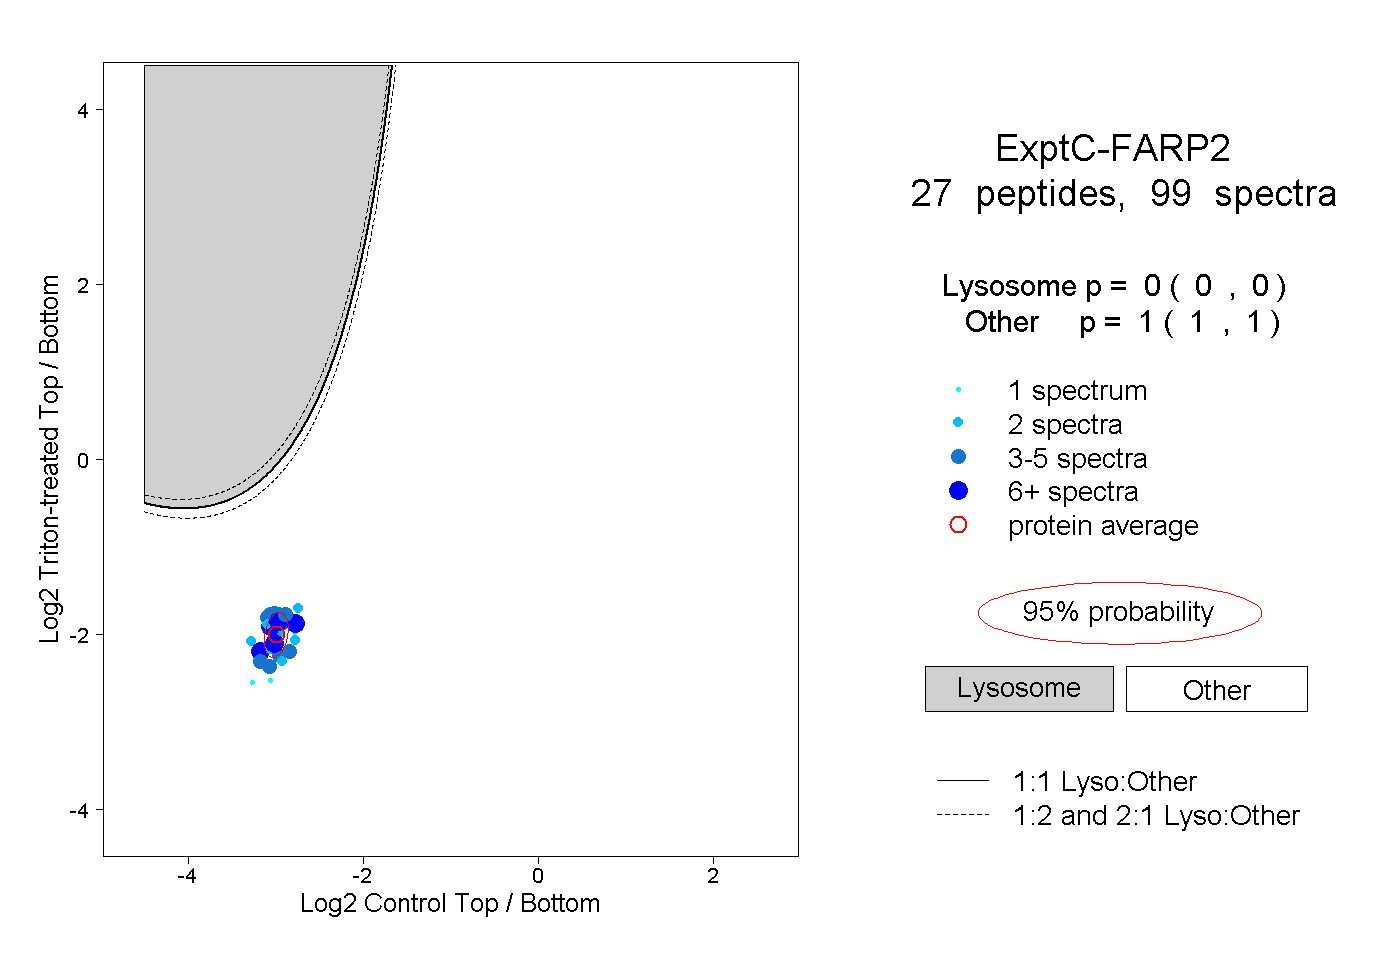
0.000 | 0.000
1.000 | 1.000
8peptides
spectra
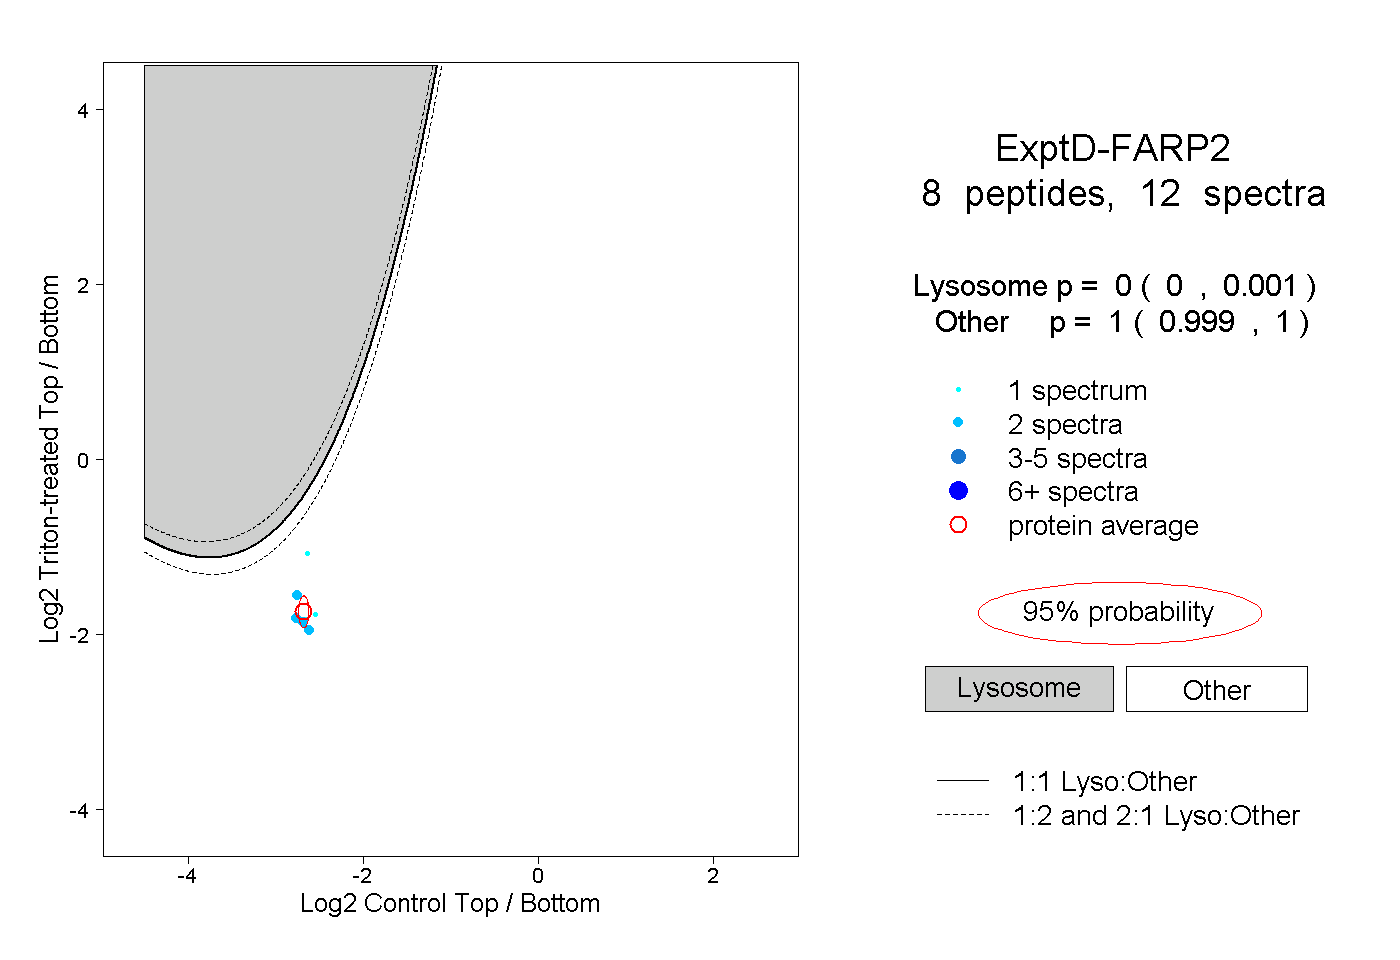
0.000 | 0.001
0.999 | 1.000