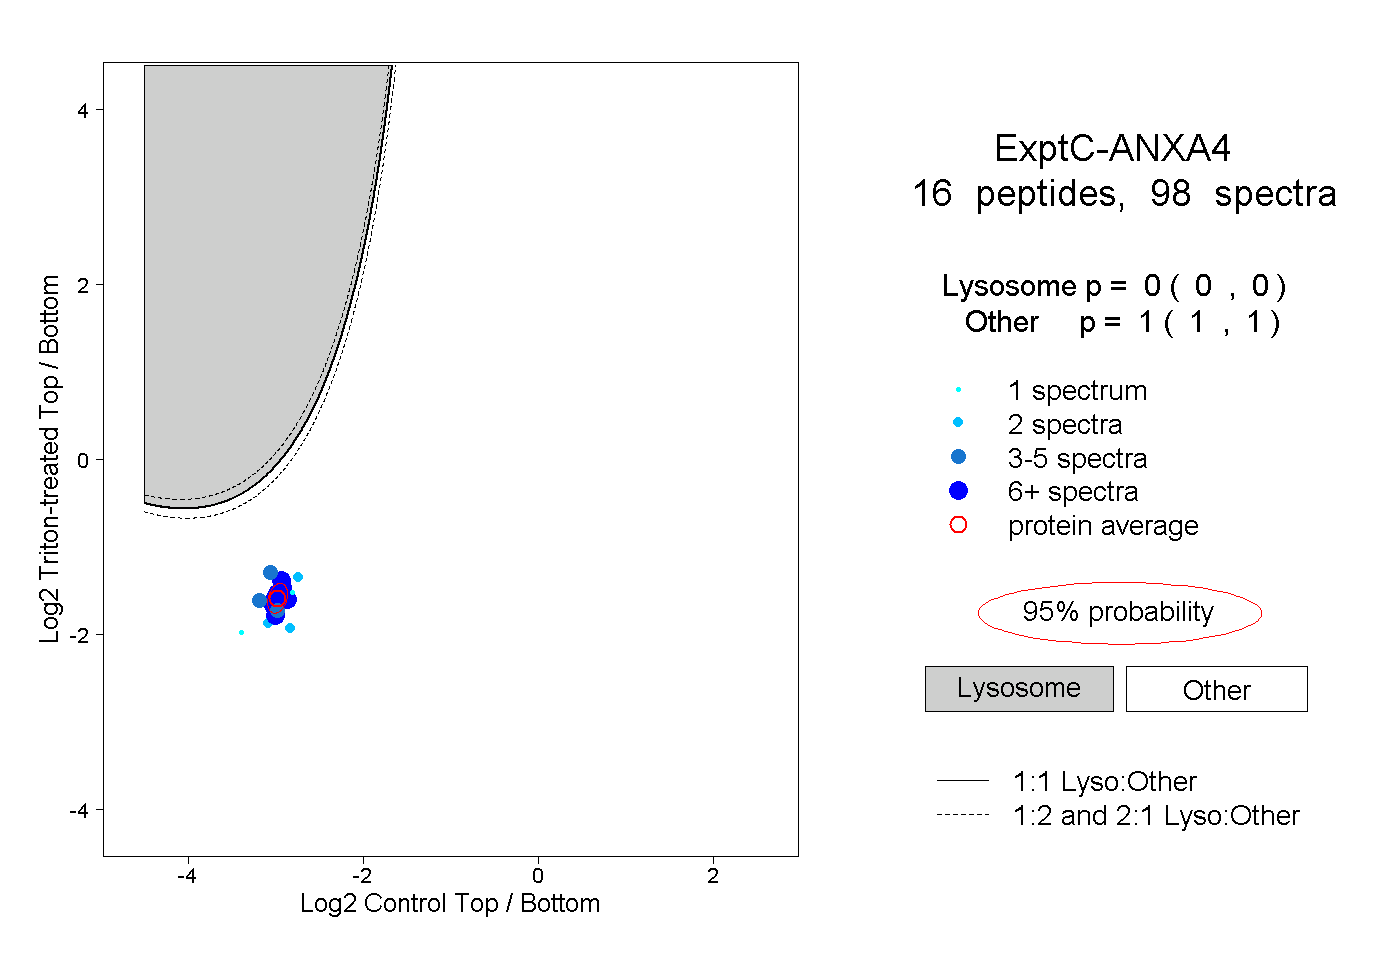
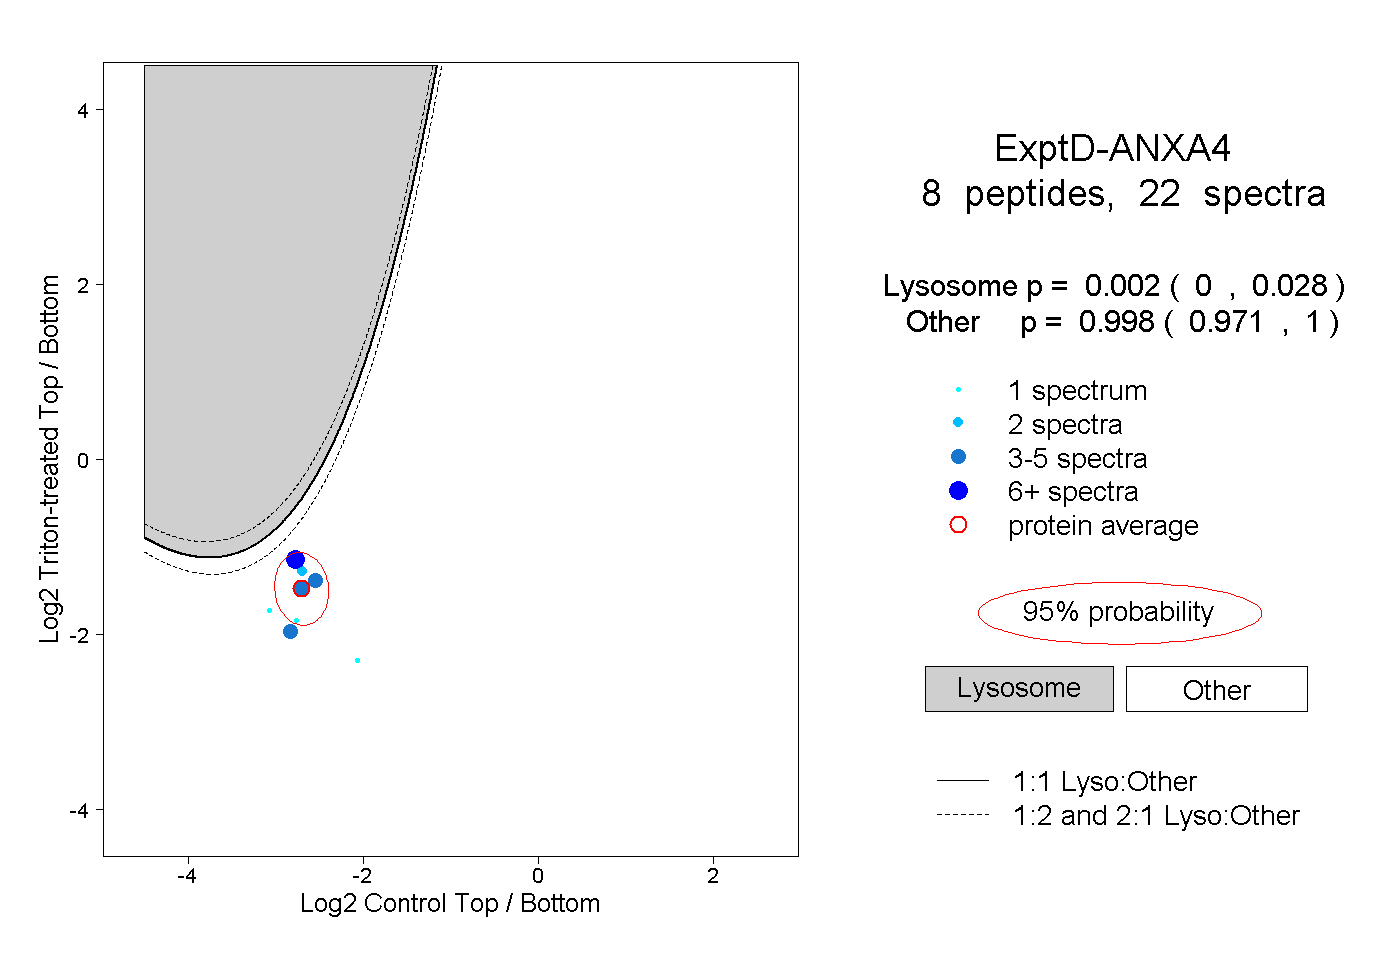
| 8 spectra, GLGTDDSTLIR |
0.000 |
|
0.041 |
|
0.472 |
0.221 |
0.000 |
0.265 |
0.000 |
|
| 5 spectra, NKPAYFAER |
0.000 |
|
0.396 |
|
0.000 |
0.450 |
0.000 |
0.154 |
0.000 |
|
| 2 spectra, GLGTDEDAIIGVLACR |
0.000 |
|
0.360 |
|
0.000 |
0.294 |
0.000 |
0.346 |
0.000 |
|
| 2 spectra, SLYSFIK |
0.000 |
|
0.000 |
|
0.391 |
0.334 |
0.000 |
0.276 |
0.000 |
|
| 1 spectrum, GAGTDEGCLIEILASR |
0.000 |
|
0.046 |
|
0.644 |
0.000 |
0.000 |
0.310 |
0.000 |
|
| 3 spectra, AEIDMLDIR |
0.000 |
|
0.000 |
|
0.454 |
0.193 |
0.000 |
0.352 |
0.000 |
|
| 1 spectrum, SETSGSFEDALLAIVK |
0.000 |
|
0.000 |
|
0.461 |
0.268 |
0.000 |
0.271 |
0.000 |
|
| 2 spectra, NPEEIR |
0.000 |
|
0.043 |
|
0.540 |
0.138 |
0.000 |
0.279 |
0.000 |
|
| 1 spectrum, QDAQDLYEAGEK |
0.248 |
|
0.333 |
|
0.000 |
0.342 |
0.002 |
0.075 |
0.000 |
|
| 2 spectra, VLVSLTAGGR |
0.000 |
|
0.000 |
|
0.596 |
0.039 |
0.000 |
0.365 |
0.000 |
|
| 1 spectrum, DEGNYLDDALVK |
0.000 |
|
0.000 |
|
0.542 |
0.122 |
0.000 |
0.336 |
0.000 |
|
| 3 spectra, INQTYQQQYGR |
0.000 |
|
0.313 |
|
0.000 |
0.583 |
0.000 |
0.105 |
0.000 |
|
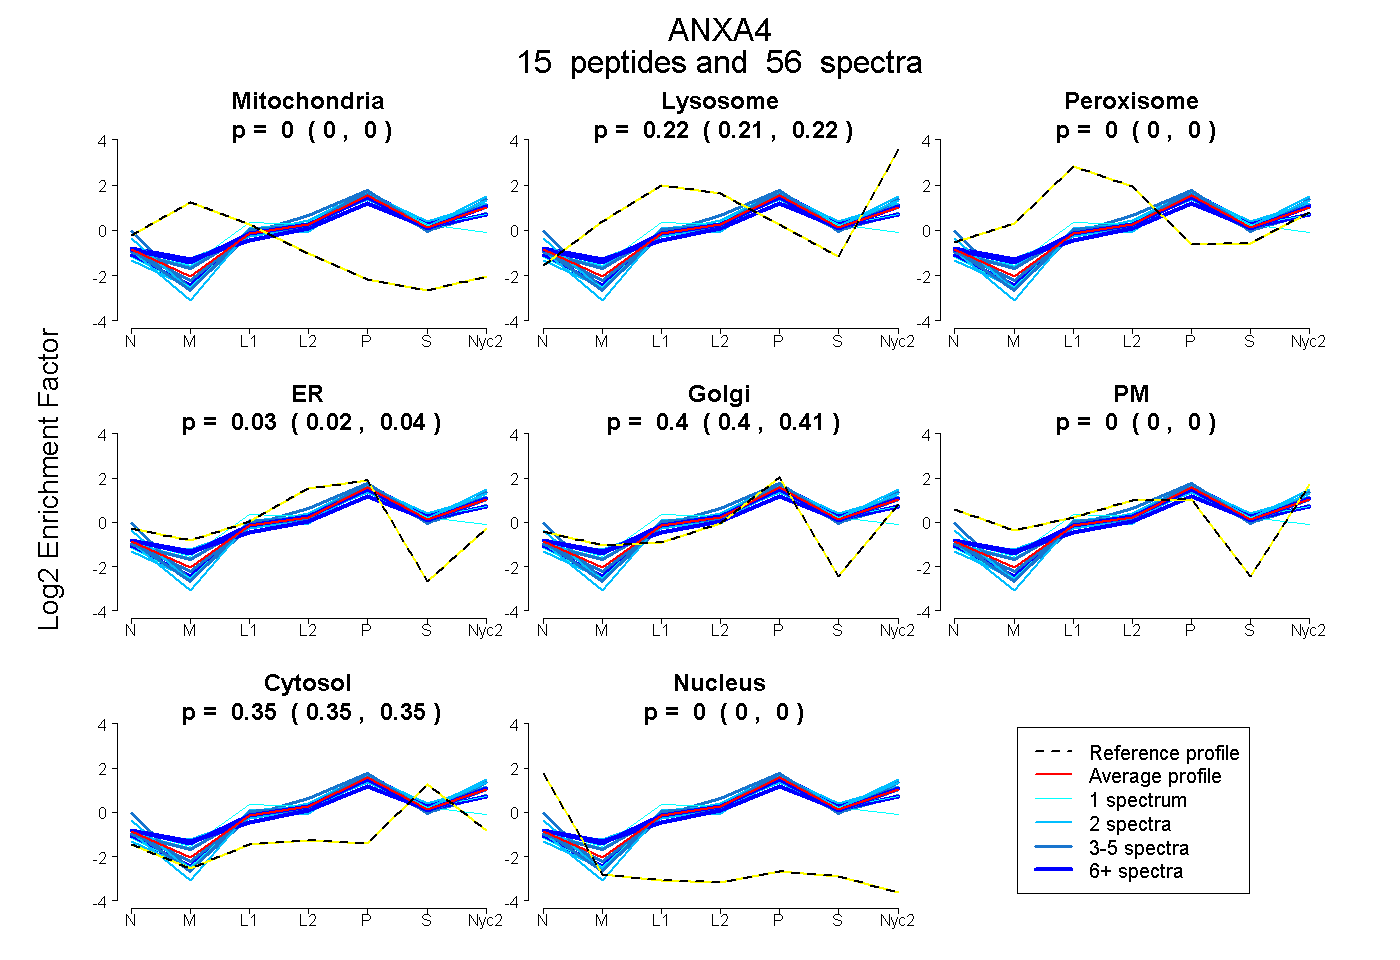
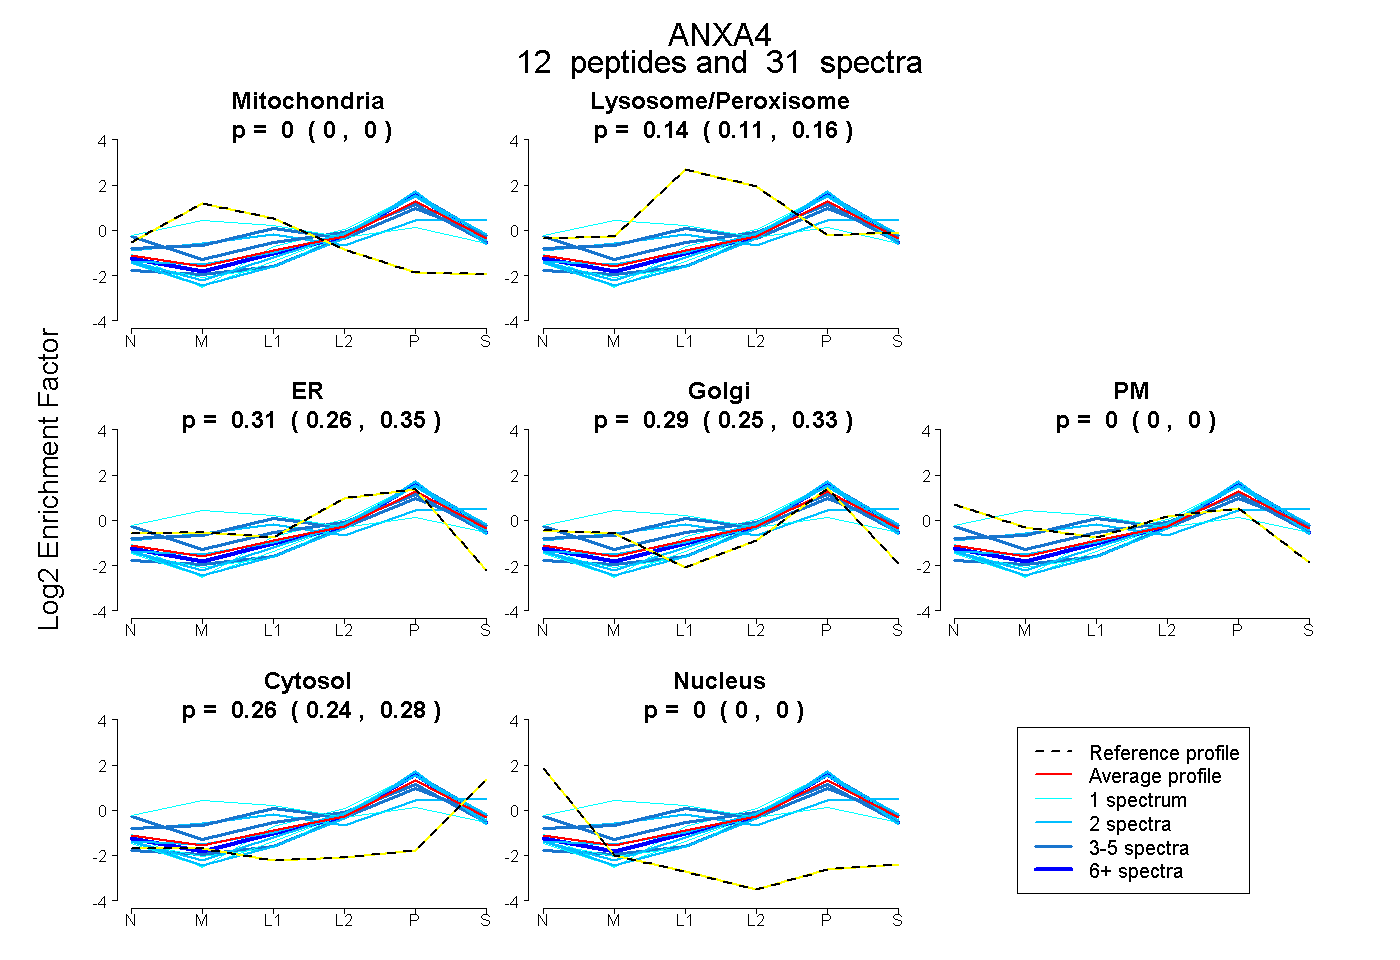
 15
15