 15
15peptides
spectra
0.000 | 0.000
0.215 | 0.222
0.000 | 0.000
0.023 | 0.035
0.396 | 0.408
0.000 | 0.000
0.347 | 0.352
0.000 | 0.000
| Plot | Mito | Lyso | Perox | ER | Golgi | PM | Cytosol | Nucleus | |||||
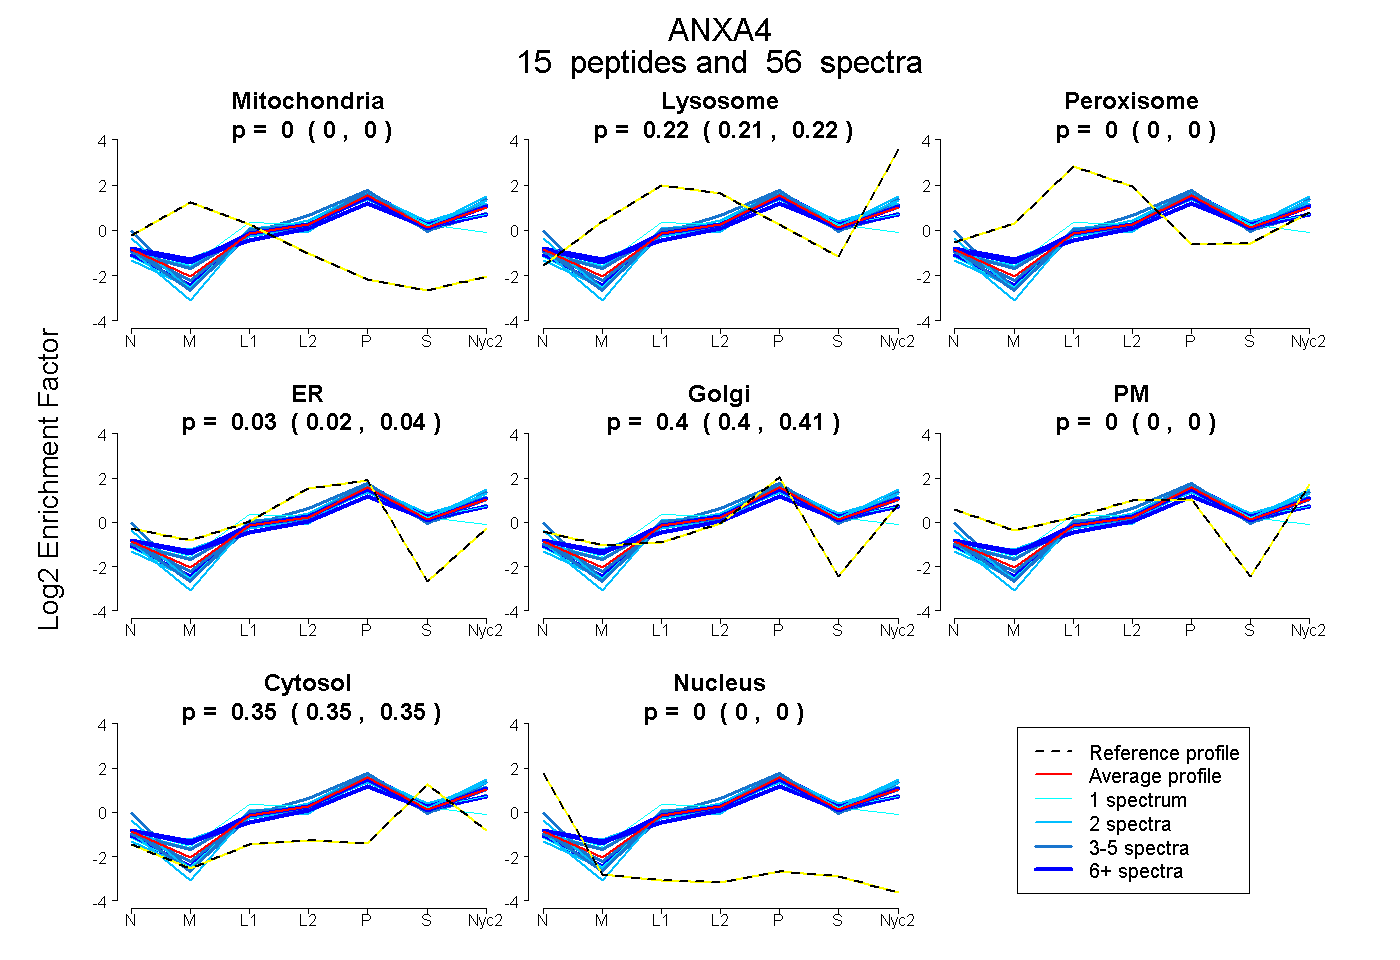
| Expt A |
15 peptides |
56 spectra |
|
0.000 0.000 | 0.000 |
0.219 0.215 | 0.222 |
0.000 0.000 | 0.000 |
0.029 0.023 | 0.035 |
0.402 0.396 | 0.408 |
0.000 0.000 | 0.000 |
0.350 0.347 | 0.352 |
0.000 0.000 | 0.000 |
| 2 spectra, GDTSGDYR | 0.000 | 0.223 | 0.000 | 0.000 | 0.368 | 0.000 | 0.409 | 0.000 | ||
| 4 spectra, GLGTDDSTLIR | 0.000 | 0.214 | 0.000 | 0.000 | 0.437 | 0.000 | 0.350 | 0.000 | ||
| 4 spectra, NKPAYFAER | 0.000 | 0.283 | 0.000 | 0.044 | 0.409 | 0.000 | 0.265 | 0.000 | ||
| 1 spectrum, GLGTDEDAIIGVLACR | 0.000 | 0.060 | 0.000 | 0.370 | 0.117 | 0.000 | 0.453 | 0.000 | ||
| 1 spectrum, AASGFNATEDAQVLR | 0.000 | 0.201 | 0.000 | 0.065 | 0.383 | 0.000 | 0.351 | 0.000 | ||
| 3 spectra, SLYSFIK | 0.000 | 0.186 | 0.000 | 0.035 | 0.431 | 0.000 | 0.348 | 0.000 | ||
| 9 spectra, AEIDMLDIR | 0.000 | 0.215 | 0.000 | 0.000 | 0.411 | 0.000 | 0.374 | 0.000 | ||
| 2 spectra, SETSGSFEDALLAIVK | 0.000 | 0.230 | 0.000 | 0.000 | 0.373 | 0.028 | 0.369 | 0.000 | ||
| 2 spectra, NHLLHVFDEYK | 0.000 | 0.218 | 0.000 | 0.000 | 0.427 | 0.000 | 0.355 | 0.000 | ||
| 7 spectra, QDAQDLYEAGEK | 0.000 | 0.203 | 0.000 | 0.043 | 0.370 | 0.000 | 0.384 | 0.000 | ||
| 13 spectra, VLVSLTAGGR | 0.000 | 0.257 | 0.000 | 0.029 | 0.396 | 0.000 | 0.319 | 0.000 | ||
| 3 spectra, DEGNYLDDALVK | 0.000 | 0.055 | 0.000 | 0.096 | 0.291 | 0.174 | 0.384 | 0.000 | ||
| 1 spectrum, SLEEDICSDTSFMFQR | 0.000 | 0.168 | 0.123 | 0.059 | 0.327 | 0.000 | 0.323 | 0.000 | ||
| 2 spectra, DIEQSIK | 0.000 | 0.216 | 0.000 | 0.071 | 0.370 | 0.000 | 0.343 | 0.000 | ||
| 2 spectra, INQTYQQQYGR | 0.000 | 0.279 | 0.000 | 0.000 | 0.446 | 0.000 | 0.275 | 0.000 |
| Plot | Mito | Lyso or Perox | ER | Golgi | PM | Cytosol | Nucleus | ||||||
| Expt B |
12 peptides |
31 spectra |
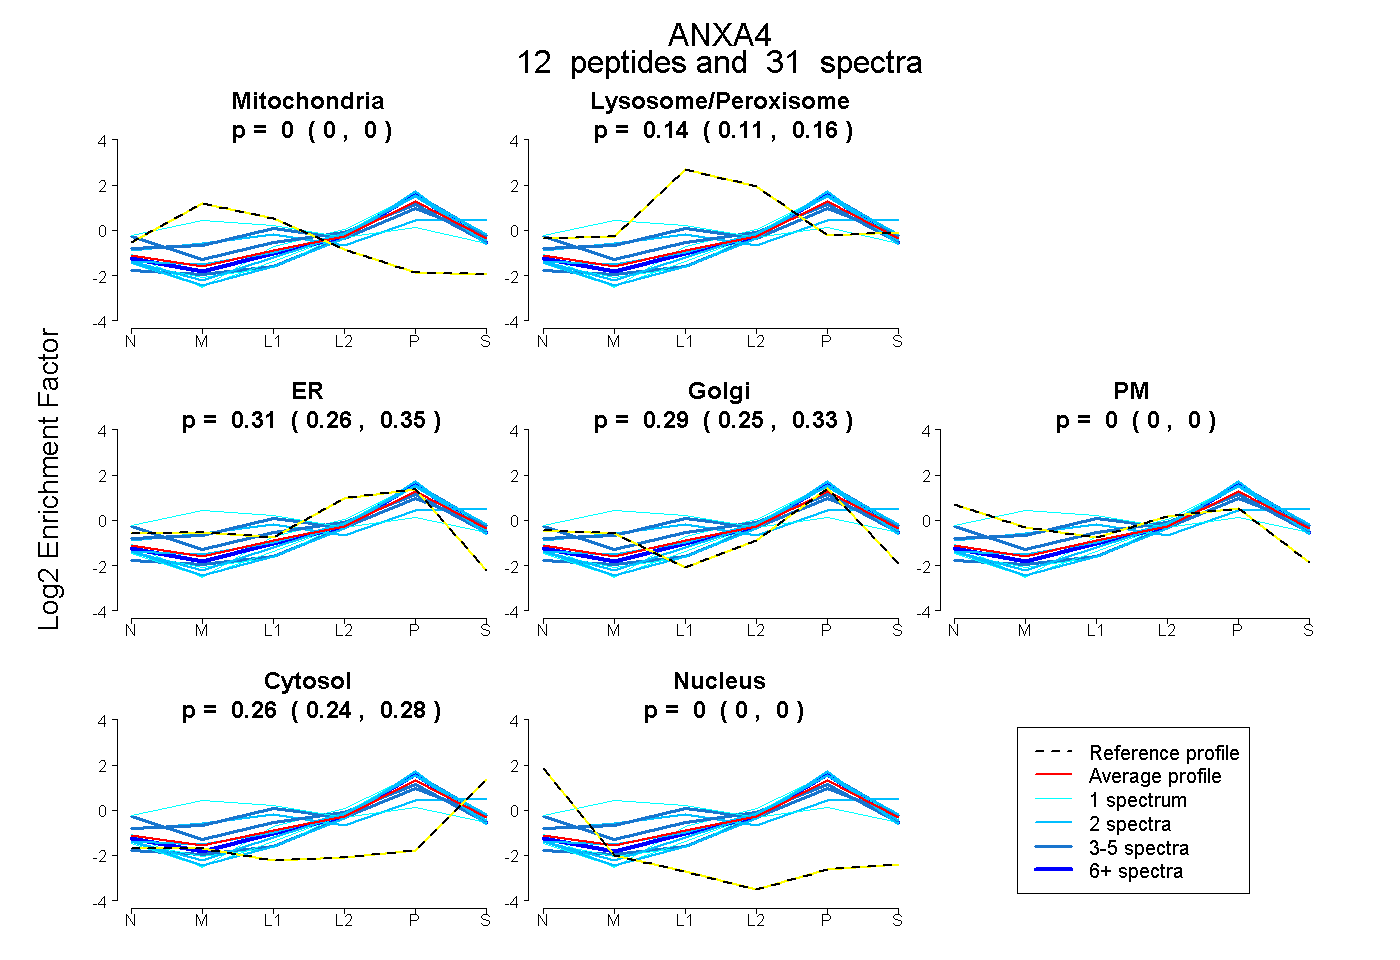 |
0.000 0.000 | 0.000 |
0.136 0.112 | 0.157 |
0.308 0.255 | 0.351 |
0.294 0.247 | 0.333 |
0.000 0.000 | 0.000 |
0.262 0.244 | 0.278 |
0.000 0.000 | 0.000 |
|||
| Plot | Lyso | Other | |||||||||||
| Expt C |
16 peptides |
98 spectra |
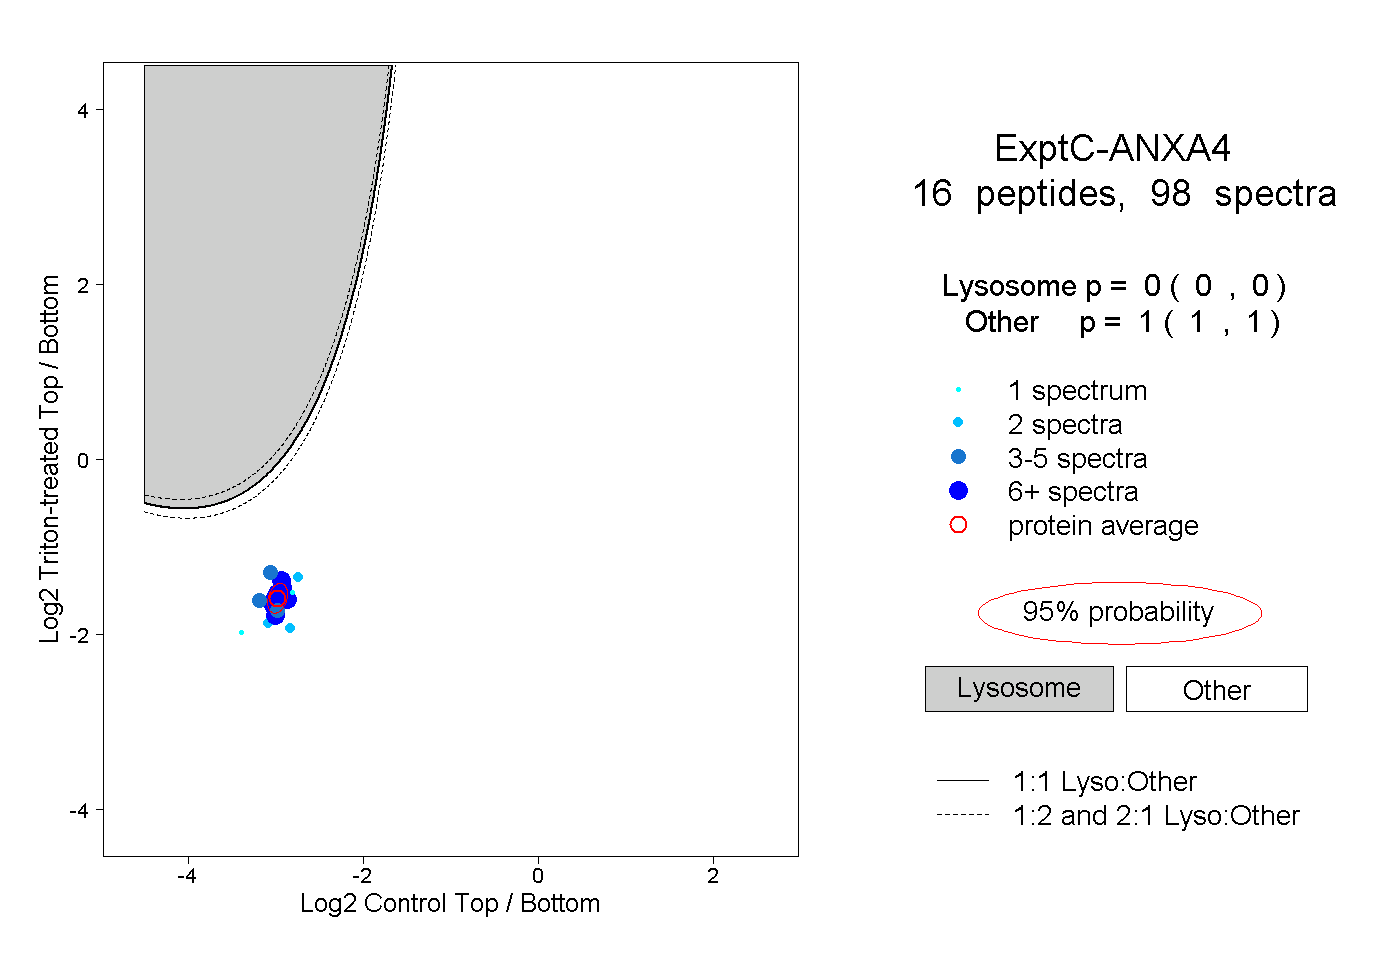 |
0.000 0.000 | 0.000 |
1.000 1.000 | 1.000 |
||||||||
| Plot | Lyso | Other | |||||||||||
| Expt D |
8 peptides |
22 spectra |
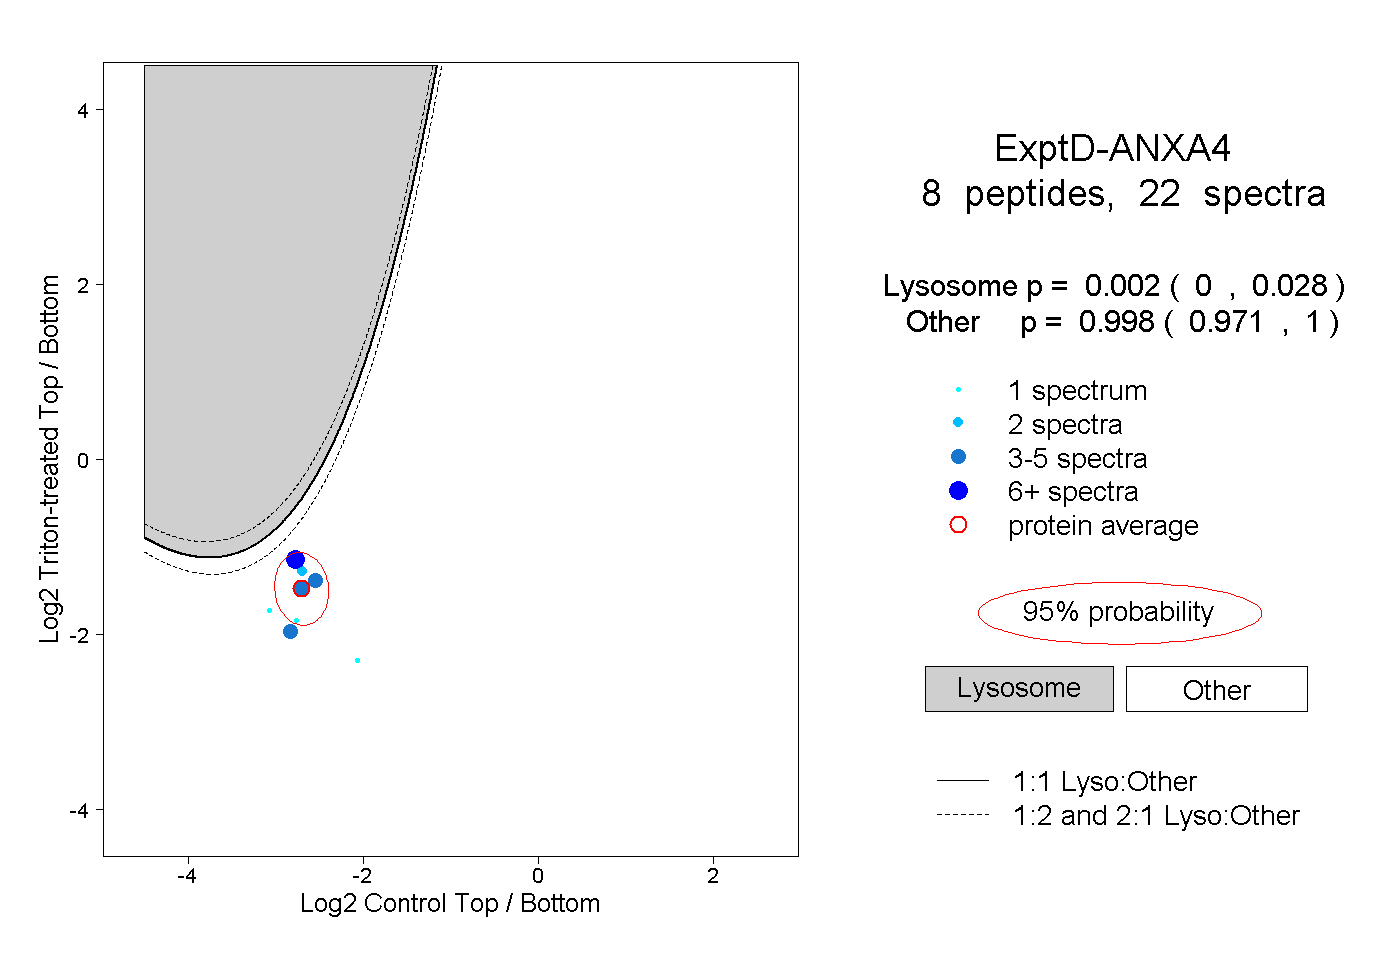 |
0.002 0.000 | 0.028 |
0.998 0.971 | 1.000 |